
In this module, we are going to explore the processes related to capturing KPI results:
(Note: clicking on the bullet points below will take you straight to that section)
- KPI Agenda
- Monthly Target (Prepayment)
- Month-to-Date (MTD) Prepayments / Collections
- MTD Target (Billings)
- MTD Billings
- Monthly Collections On Track (Not Behind on WoW Collections)
- Monthly Billings on Track (Not Behind on WoW Billings)
- WoW NPs on Track?
- MTD NPs on Track?
- Last 90 Days Average Deal Size
- MTD Average Deal Size
- 7 Days Consult Conversion (>38%)
- 30 Days Consult Conversion (>45%)
- 30 – 60 Days Consult Conversion (>50%)
- 60 – 90 Days Consult Conversion (>60%)
- Total in Super Approved (Finance Pending)
- Monthly Google Reviews Target
- MTD Google Reviews Received
- Achieved?
- Total # of Google Reviews
- Monthly Missed Calls Target
- Total # New Bad Debts Received MTD
- Total # Number of Bad Debts
- Total $ Value of Bad Debts
- Total Responses Received from TLC Feedback Form Last Week
- Total # of <5 Star Responses
- Total Re-preps/Re-dos/Re-inserts (Advise type)
- Clinical Complaints – Advise pt name
- Running on time for patient appointments? (Yes, sometimes, No)
- Safety Culture Up to date?
- HR – Offboarded Employees (Name – When – Why)
- HR – Onboarded Employees (Name – When – Role)
- HR – Performance Management? (Who – Why – Plan)
- HR – New Dentist Starting In Next 4 Weeks? (Name – Role – Capacity)
- Key Notes
KPI Agenda
To be filled prior to your KPI meeting, which is held once every 3 weeks.
Click here to return to the top of this page
Monthly Target (Prepayment)
This will be found on the Budget tab of the KPI spreadsheet – input the data from there.
Click here to return to the top of this page
Month-to-Date (MTD) Prepayments / Collections
Process For Clinic
Platform: Core
Navigation:
Access the report via Core Practice > Reports (top menu) > Payment Received
Follow the instructions in the images above
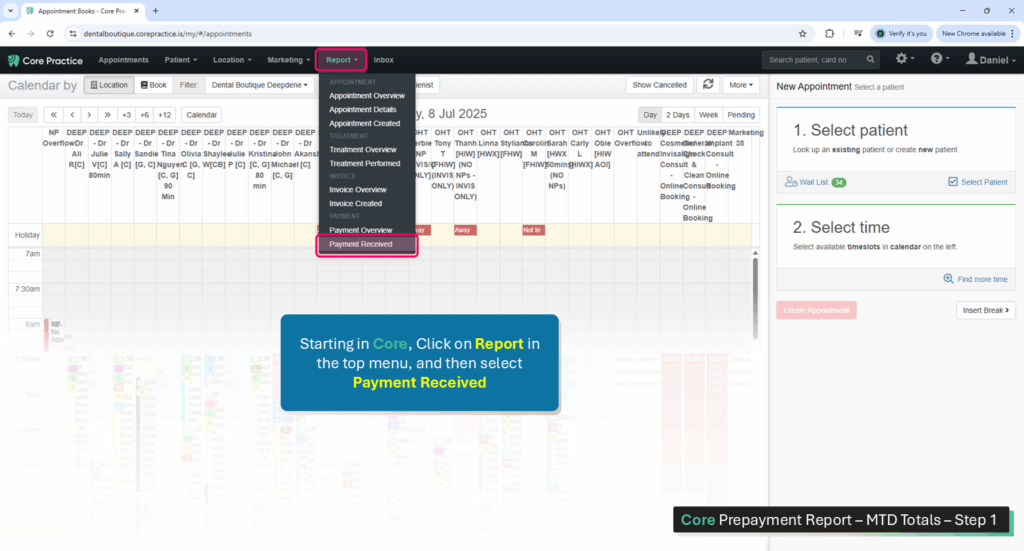
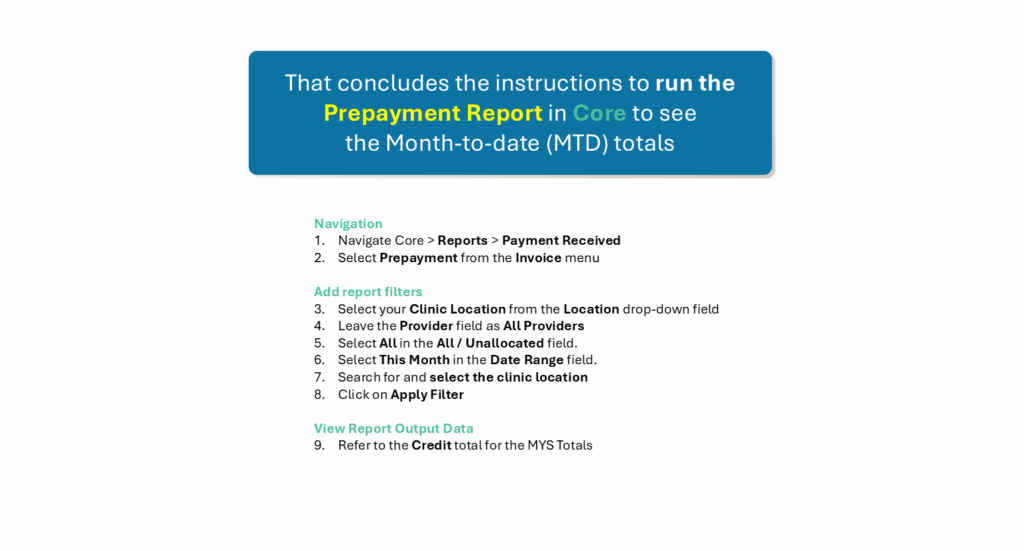
To access the report, navigate Core > Report > Payment Received
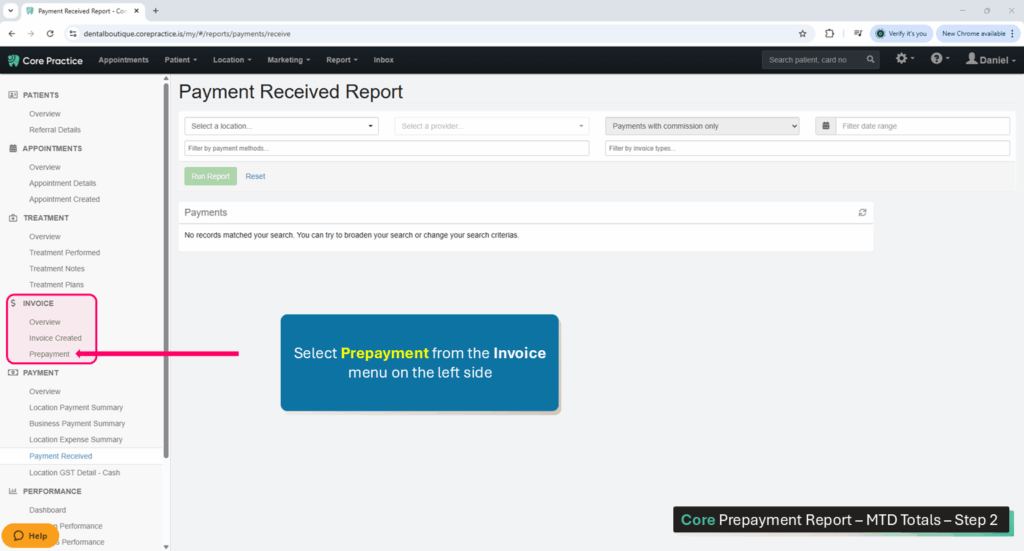
A list of report options will appear on the left side of the screen. Select Prepayment from the Invoice section.
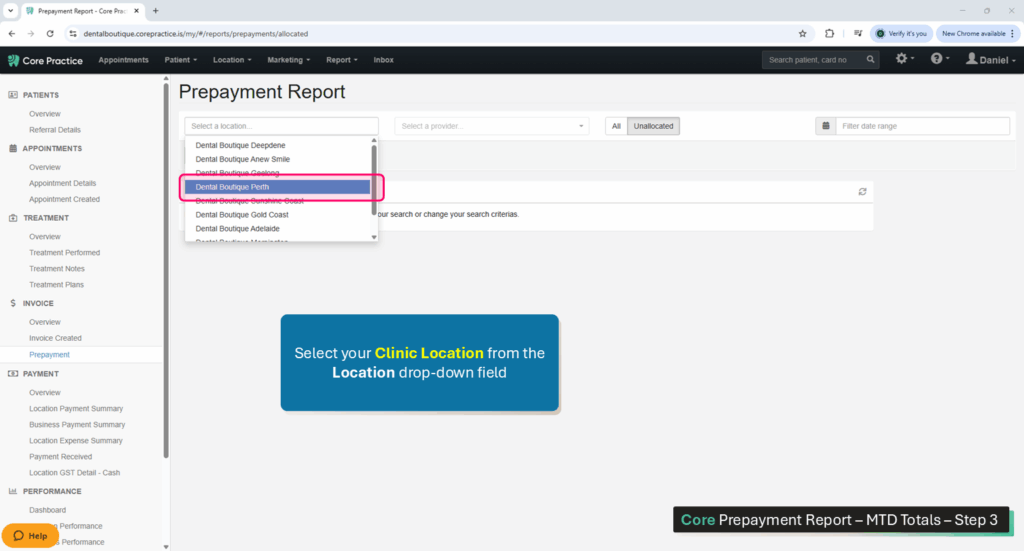
For the first filter, select your Clinic Location from the Location drop-down field.
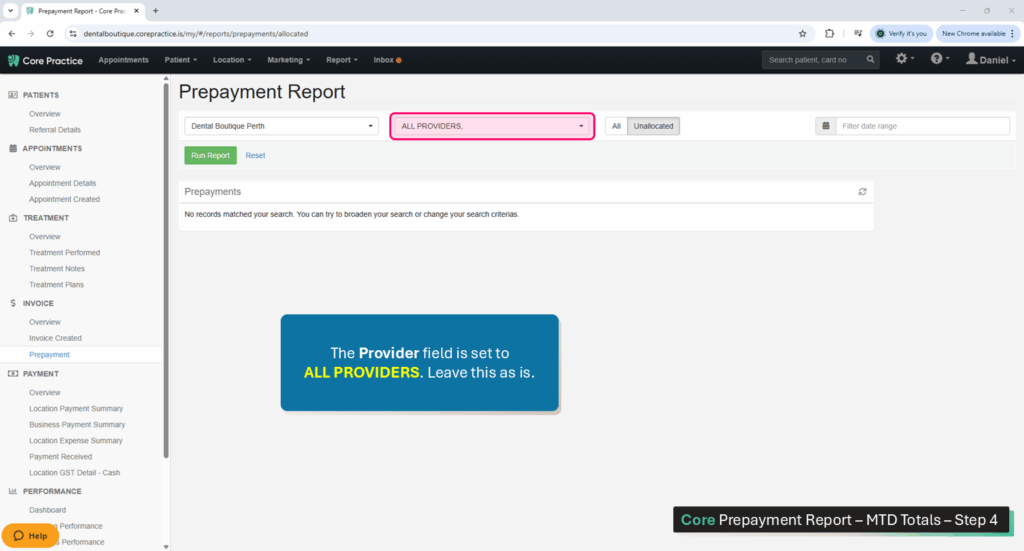
The Providers filter defaults to ALL PROVIDERS. Leave this as is.
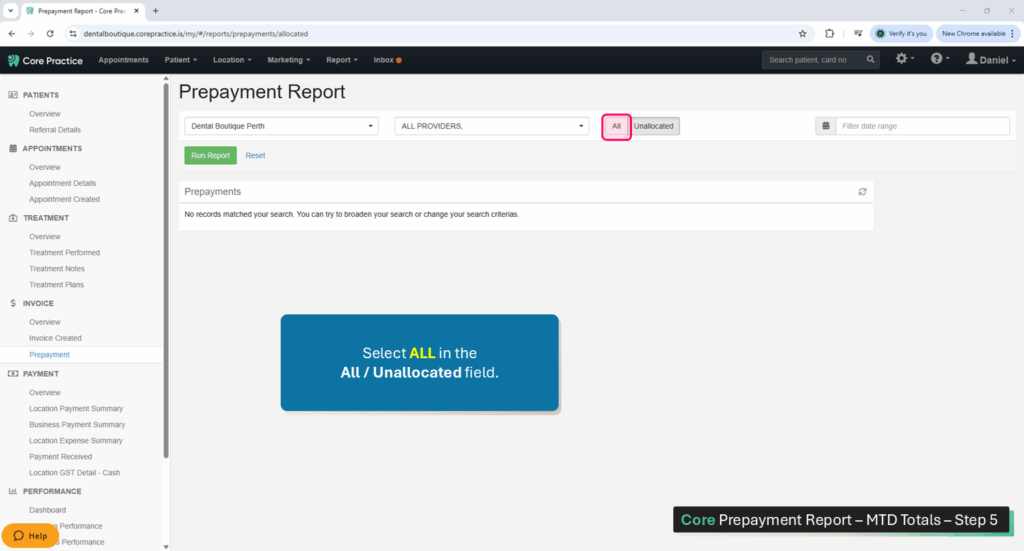
Select ALL in the All / Unallocated filter.
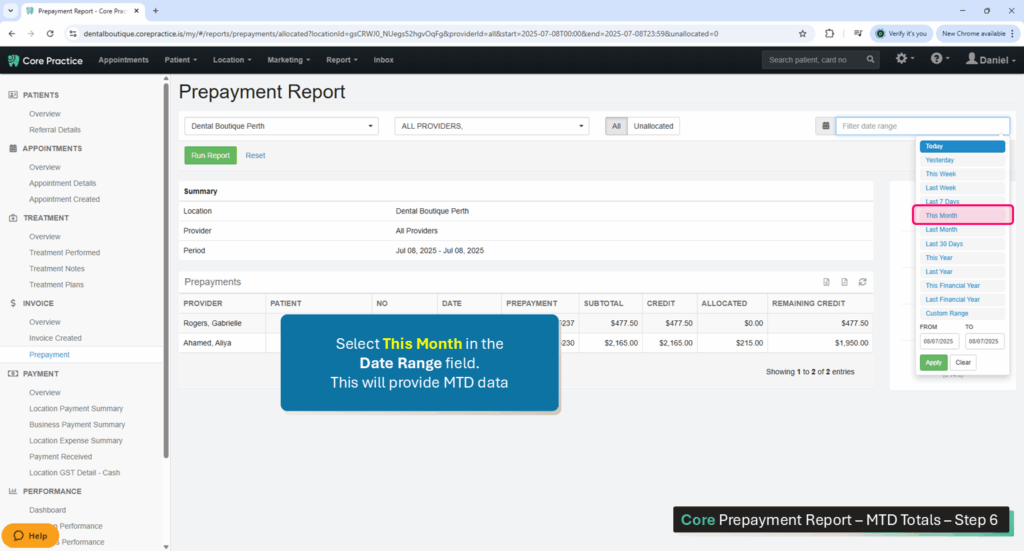
Click into the Date Range field and select This Month. this will provide Month-to-Date (MTD) data.
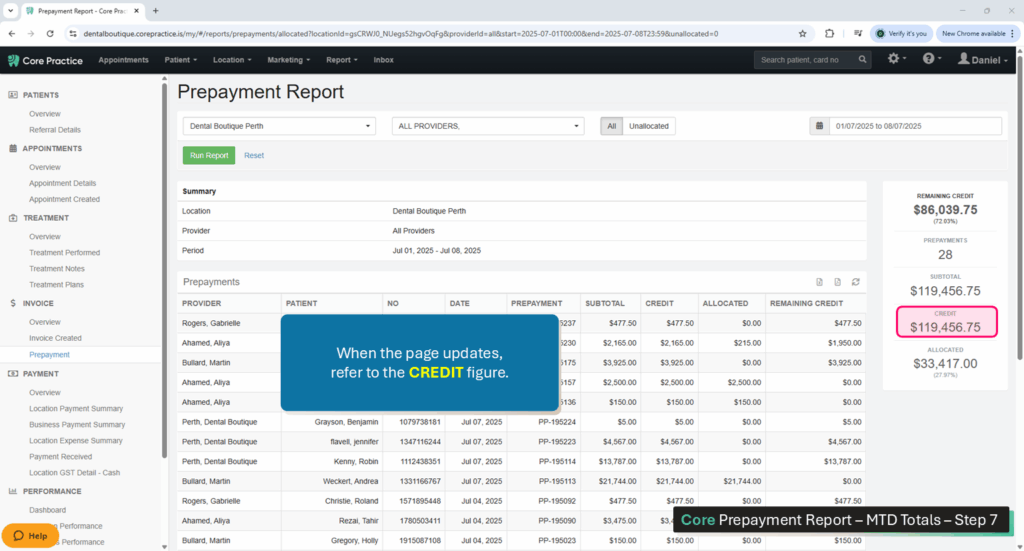
When the screen refreshes, refer to the CREDIT field to see the MTD total.
This is an overview of the process.
Process For Clinicians
Platform: Hubspot
Navigation:
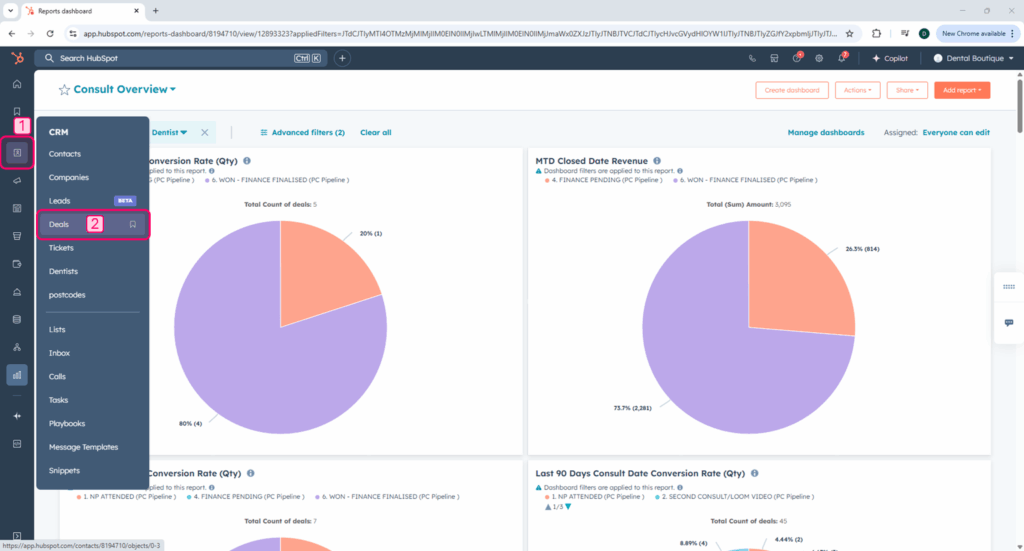
Open Hubspot
1. Select CRM (left menu)
2. Select Deals (sub menu)
Select Dashboard and Add Filters:
Select the correct dashboard:
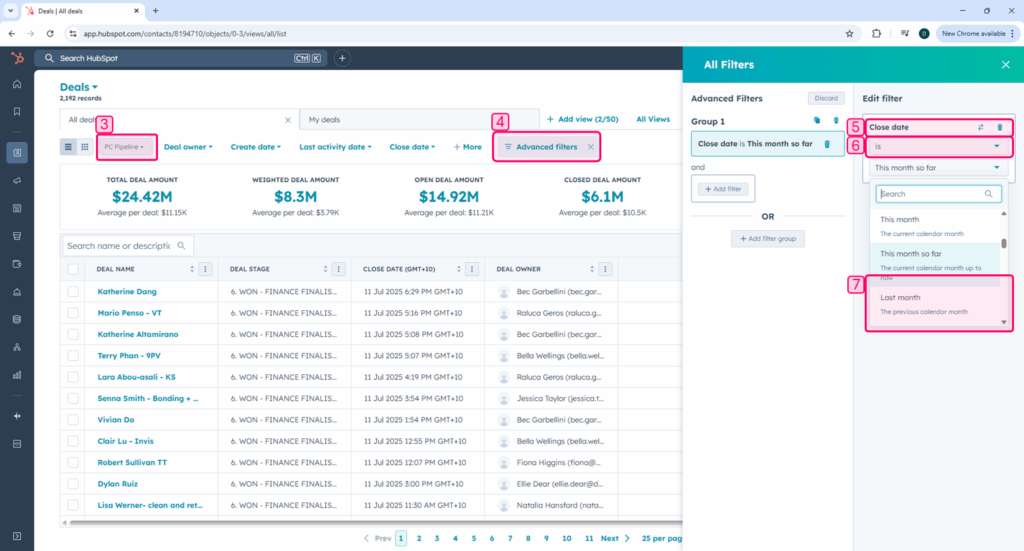
3. Ensure that the PC Pipeline dashboard is selected
Filter 1 (Close Date):
4. Select Advanced Filters (top menu)
5. Search for Close Date and select it
6. Leave the top drop-down field with the word is
7. Click on the bottom drop-down field and select This month so far
There are 2 more filters to add (Dentist and Deal Stage). Add them the same way as the first filter.
Filter 2 (Dentist):
5. Search for Dentist and select it
6. Leave the top drop-down field with the word is
7. Expand the bottom drop-down field and select the Dentist that you require data for
Filter 3 (Deal Stage):
5. Search for Deal Stage and select it
6. Leave the top drop-down field with the word is
7. Click on the bottom drop-down field and select WON – Finance Finalised (PC Pipeline).
Viewing the Results
Toggle the results from list view to board view.
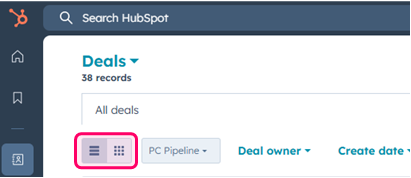
This is where to look for your results:


Click here to return to the top of this page
MTD Target (Billings)
This is the same process as Collections (directly above). Reach out to Sophie for assistance on this if a dentist is on leave, etc..
Click here to return to the top of this page
MTD Billings
Platform: Core
Navigation:
Access the report via Core Practice > Reports (top menu) > Payment Received
Select Filters:
Location: [select your location]
Providers: ALL PROVIDERS
Payments: All Payments
Date: select range
Filter by payment Methods: BLANK
Filter by invoice types: Credit, Invoice
RUN REPORT
To find the clinician, it is the same as above, however under the provider you would select the clinician name instead of all providers.
TIP: If you have a referral system (Akansha Kumar2) then you would need to run the report for Akansha Kumar and then again for Akansha Kumar2, you would need to plus these numbers together for the combined total.
Click here to return to the top of this page
Monthly Collections On Track [Not behind on WoW Collections]
Input ‘Not On Track’ Or ‘On Track’ depending on the data.
Click here to return to the top of this page
Monthly Billings On Track [Not behind on WoW Billings]
Input ‘Not On Track’ Or ‘On Track’ depending on the data.
Click here to return to the top of this page
WoW NPs on Track?
Have the clinic and your clinicians been seeing enough New patients each week?
Have they been meeting their pre-blocked amount?
Platform: Core
Navigation:
Access the report via Core Practice > Reports (top menu) > Appointment Details
Select Filters:
Location: [select your location]
Date: Enter the dates of previous weeks (e.g. check 5-9 May, then check 12-16 May etc)
Filter by Attendance: Attended
Filter by appointment status: BLANK
Filter by appointment reason: Select ALL new patient appointment types
If you were doing this for a specific dentist you would click on Calendar instead of Location on the top of the report.

Click here to return to the top of this page
MTD NPs on Track?
Is the clinic, and are the dentists, on track to meet their new patient requirements?
Run the same report as above, but instead of weekly, you would change the date range to MTD.
Click here to return to the top of this page
Last 90 Days Average Deal Size
What: The last 90 days Conversion
Platform: Hubspot
Navigation:
Open Hubspot
Select Reporting (left menu)
Select Dashboards (sub menu)
Dashboard:
Dentist & PC WoW stats
Quick Filters:
Quick Filter: Clinic Location
Operator (first drop-down menu): is any of
Second drop-down menu: [select your clinic from the list]
Scroll down until you see ‘Dentist Average Deal Size – Won Consult Date Last 90 Days’
Record Individual clinician figures, the clinic figure will be the ‘report total’ at the bottom.
Click here to return to the top of this page
MTD Average Deal Size
What: MTD Average Deal Size
Platform: Hubspot
Navigation:
Open Hubspot
Select Reporting (left menu)
Select Dashboards (sub menu)
Dashboard:
Dentist & PC Stats – Consult Date
Quick Filters:
Quick Filter: Date Range
Operator (first drop-down menu): is
Second drop-down menu: This month so far
Quick Filter: Clinic Location
Operator (first drop-down menu): is any of
Second drop-down menu: [select your clinic from the list]
Scroll down until you see ‘Dentist Average Deal Size – Won Consult Date’
Click here to return to the top of this page
7 Days Consult Conversion (>38%)
30 Days Consult Conversion (>45%)
30 – 60 Days Consult Conversion (>50%)
60 – 90 Days Consult Conversion (>60%)
Platform: Hubspot
Navigation:
Open Hubspot
Select Reporting (left menu)
Select Dashboards (sub menu)
Dashboard:
Consult Overflow
Quick Filters:
Quick Filter: Clinic Location
Operator (first drop-down menu): is any of
Second drop-down menu: [select your clinic from the list]
Quick Filter: Dentist
Operator (first drop-down menu): is any of
Second drop-down menu: [select Clinician name]
Scroll down until you see 7 day data, the first pie chart is conversion, 2nd is revenue and 3rd is average deal size. You need to look at the WON value for each period.
Continue scrolling down for 30 day, 30 – 60 day & 60 – 90 day metrics.
TIP: if the clinician you are looking at sees a lot of AOI patients or sees a lot of super release patients, you would expect their won percentage to be smaller than the suggested range, however they should have a large portion in finance pending. Red flags are when there is a large amount of deals in NP attended or Lost.
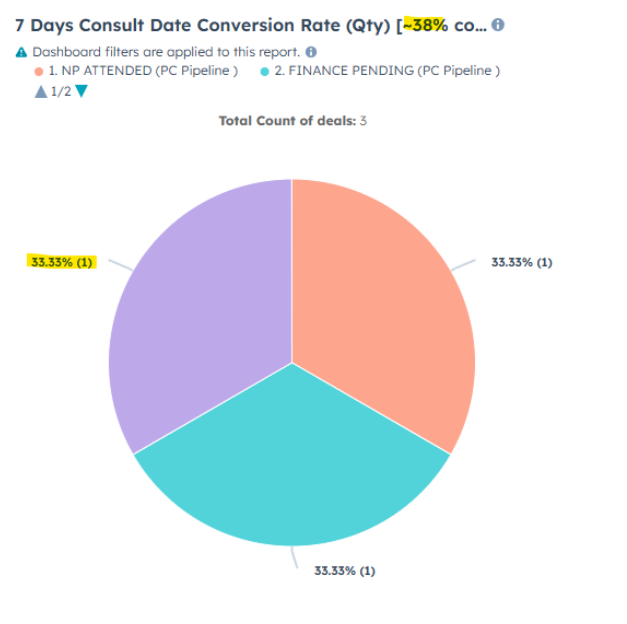
In the title of the pie chart, there will be a guide, for 7 days, the guide is 38% +
- In the example above, this clinician has only seen 3 deals over the past 7 days, and 1 deal has gone into won, meaning his conversion is sitting at 33.33%.
- Hover over the colour to make sure you are looking at Won – Won is usually purple however sometimes the colours will change.
Click here to return to the top of this page
Total in Super Approved (Finance Pending)
What: Super Approved (Finance Pending)
Platform: Hubspot
Navigation:
Open Hubspot
Select CRM(left menu)
Select Deals (sub menu)
Dashboard:
PC Pipeline
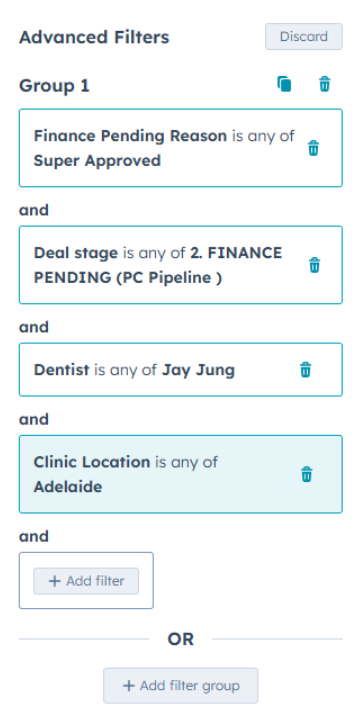
Advanced Filters:
Add Filter: Dentist
Operator (first drop-down menu): is any of
Second drop-down menu: [select Clinician name]
Add Filter: Deal Stage
Operator (first drop-down menu): is any of
Second drop-down menu: Finance Pending (PC Pipeline)
Add Filter: Finance Pending Reason
Operator (first drop-down menu): is any of
Second drop-down menu: Super approved
Click here to return to the top of this page
Monthly Google Reviews Target
This is a pre-populated field.
Click here to return to the top of this page
MTD Google Reviews Received
Google your clinic, eg. “Dental Boutique Perth” and click on the reviews
Count the number of reviews published this month.
Click here to return to the top of this page
Achieved?
This is a pre-populated field. (received / target as a %)
Click here to return to the top of this page
Total # of Google Reviews
Google your clinic, eg. “Dental Boutique Perth“

Click here to return to the top of this page
Monthly Missed Calls Target
What: Missed Calls
Platform: Aircall
Navigation:
Log into Aircall
Select Analytics(left menu)
Select Overview (sub menu)
Filters:

Date: This Month
Timezone: [select your timezone]
Date Breakdown: is daily
Numbers: [select your phone numbers]
UPDATE
Scroll down until you see this report:

The number you will need to note down is ‘Not answered by agents’
Click here to return to the top of this page
Total # New Bad Debts Received MTD
Pull the bad debt report to make sure that all bad debts have been accounted for in the payment issues spreadsheet. If not, discuss with the FOC team / FOC TL and update the spreadsheet.
Platform: Core
Navigation:
Access the report via Core Practice > Reports (top menu) > Treatment Performed
Select Filters:
Location: [select your location]
Providers: ALL PROVIDERS
Date: ALL TIME (since opening the clinic)
Treatment code: BLANK
RUN REPORT
Export to Excel:
Click on the ‘export to excel‘ button

Once the document is up, CTRL + F and type NOT PAID
This will show you any invoice lines that have not been paid.
You will need to search the patient, and go into their invoices to work out what has happened.
Check payment issues spreadsheet to ensure FOC has recorded the bad debt, if not on there determine why.
- Is the report not being pulled?
- Is the report not being pulled correctly?
You will then go into the file to see if you can resolve the bad debt.
- Is there a prepayment we can use? Check ACC note and TX plan.
- Did the patient pay via bank transfer? Have the funds landed yet?
- Was a payment plan set up? Have the funds landed yet?
- Did the patient get walked out and not seated at FOC?
- Has the bad debt been contacted in an attempt to resolve?
Work on this with the FOC team to ensure bad debts are kept to a minimum.
Count how many bad debts were from this month and enter them into the KPI spreadsheet.
Click here to return to the top of this page
Total # Number of Bad Debts
This is the total number of all bad debts.
Click here to return to the top of this page
Total $ Value of Bad Debts
This is the total dollar value of bad debts.
Click here to return to the top of this page
Total Responses Received from TLC Feedback Form Last Week
This is the link to the feedback responses: https://docs.google.com/spreadsheets/d/1eQgIpEpB1Re2T76I7Ggpl_EMBQSJ7X6JuQvpT2ADXCM/edit?usp=sharing
You will need to check these daily to make sure responses are positive or to address any negative responses.
For this section of the KPI checklist you will need to count the amount of TLC responses received last week – just check the dates on the far RHS ‘timestamp’ column to count how many were received.
Click here to return to the top of this page
Total # of <5 Star Responses
Count responses under 5 stars – this will be for their overall experience rating.
Click here to return to the top of this page
Total Re-preps/Re-dos/Re-inserts (Advise type)
Platform: Core
Navigation:
Access the report via Core Practice > Reports (top menu) > Appointment Details
Select Filters:
Location: [select your location]
Date: MTD
Filter by Attendance: Attended
Filter by appointment status: BLANK
Filter by appointment reason: Re-Prep, Re-do, Re-inserts
If you were doing this for a specific dentist you would click on Calendar instead of location on the top of the report.
Note down the patient name, appt type, and provider name.
Click here to return to the top of this page
Clinical Complaints – Advise pt name
Record any patient complaints that relate to clinical concerns in this section.
Example: Patient x was not happy with her composite veneers done by Dr X. I spoke to the patient and diffused the situation. She is coming in tomorrow for a polish as she felt they were still rough and matte.
Click here to return to the top of this page
Running on time for patient appointments? (Yes, Sometimes, No)
Generally speaking – are we consistently running on time, consistently late or sometimes on time / sometimes late. Add a comment here if there are any repeat offenders.
Click here to return to the top of this page
Safety Culture Up to date?
Safety culture is a program used to ensure the site is compliant.
Myf and Philip from our risk and compliance team will be your point of contact for any issues surrounding this program. Your clinical team lead / senior dental assistant will be in charge of ensuring the audits have been completed and all action items have been crossed off.
Website address: https://app.au.safetyculture.com/
Look at the LHS menu, select actions

Filter > Site location = Dental Boutique Perth
Filter > Status = To Do
The list will be any outstanding tasks that are required from the previous audit. Discuss these tasks with your Clinical Team Lead or DA in charge of this. Go through each one with them and ensure steps are in place to get them completed.
Make a note in the KPI about the status of the current audit.
Click here to return to the top of this page
HR – Offboarded Employees (Name – When – Why)
Have you offboarded anyone since the last KPI meeting? Who, when was their last day and why?
Click here to return to the top of this page
HR – Onboarded Employees (Name – When – Role)
Have you onboarded anyone since the last KPI meeting? Who, when is their first day and what is their role?
Click here to return to the top of this page
HR – Performance Management? (Who – Why – Plan)
Is anyone currently under a performance improvement plan?
If so, who is the employee, why are they currently on an improvement plan and what has been implemented?
For example – Yes – employee X is under performance management due to her consistent attitude towards colleagues. Chanelle (HR) and I have put together a plan where we are meeting with her weekly for 3 weeks to gauge any improvement / regression. If she shows no improvement by at her first weekly meeting, we will be issuing her a warning.
Click here to return to the top of this page
HR – New Dentist Starting In Next 4 Weeks? (Name – Role – Capacity)
Is there a new dentist starting in Perth within the next 4 weeks? If so, what is their name, what is their role, how many days a week will they be starting, what will be their main focus?
For example, Dr X is starting with us on the 30th of May, he/she will be full time, 5 days a week. He/she has a lot of cosmetic experience, so we are really looking forward to growing our cosmetic space with his/her help.
Click here to return to the top of this page
Key Notes
You will attend KPI meetings with people who are likely to be quite time poor and so they need the bigger picture to always be at the forefront of the data that you input and the conversations you have.
Big picture pillars
- Billings – is the clinic making enough money – if not, why?
- Collections – is the clinic collecting enough money – if not, why?
- Growth – is the clinic moving in a positive direction for growth – if not, why?
- Staffing – do we have the right type of people in the right roles – if not, why?
- Do you have enough staff to support the site?
- Outcomes – are our patients happy? Are we giving them luxury and exceptional service in all areas of their visit?