
In this module, we are going to explore the following reports in Hubspot:
- Report 1 – Daily Stats
- Report 2 – Hubspot vs Core Report
- Report 3 – Deal Tags
- Report 4 – WoW Dentist Stats
- Report 5 – WoW PC Stats
Note: clicking on the bullet points will take you straight to that section.
Hubspot Reporting – Report 1 – Daily Stats
To set up the Dashboard to view the daily stats, compete the following steps:
- Navigation
- Select the Dashboard
- Add filters (Clinic Location & Dentist)
- Viewing the Dashboard
- Viewing the Dashboard: Understanding the Data
Hubspot Reporting – Report 1 – Daily stats
1. Navigation:
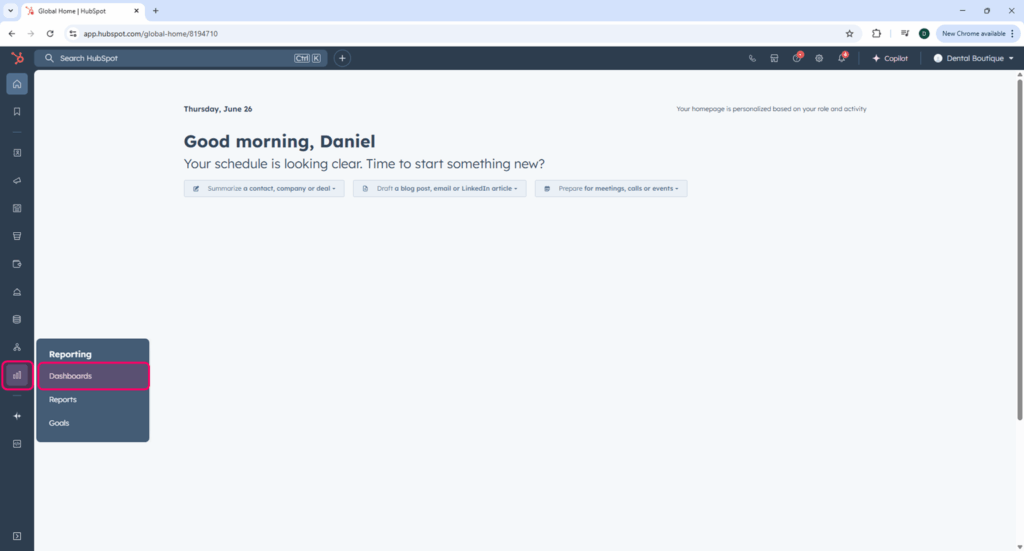
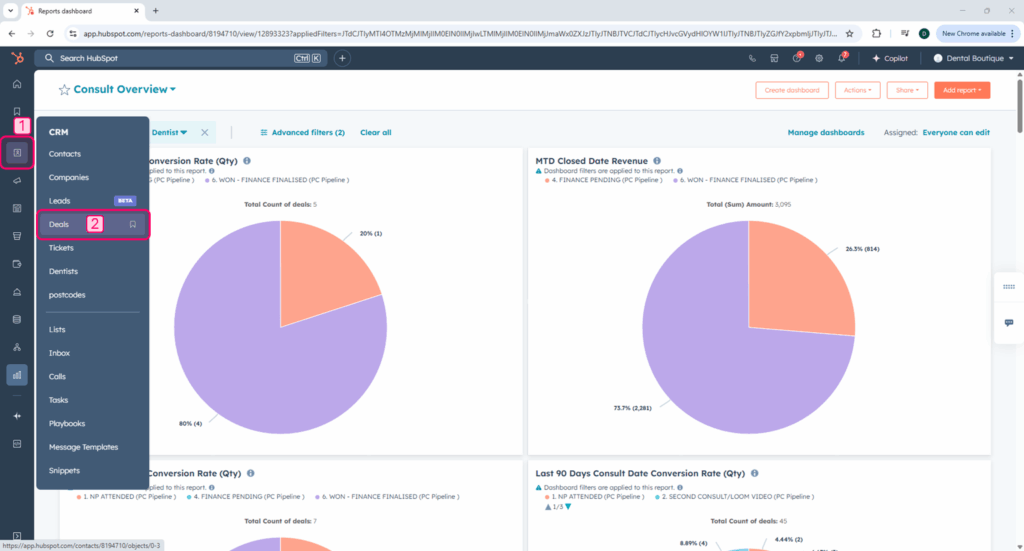
Access the Dashboards via Hubspot Homepage > Reporting (vertical bars icon in the left side menu) > Dashboards
Hubspot Reporting – Report 1 – Daily stats
2. Select Your Dashboard:
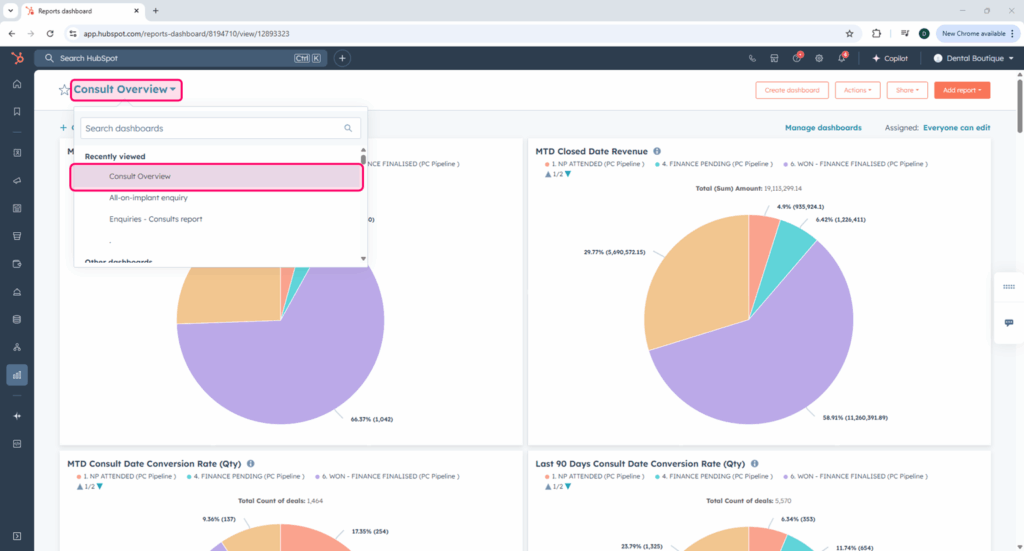
Ensure that the correct dashboard is displayed. You can select the Dashboard that you require by clicking on the Dashboard title at the top left of the screen, and then select the required dashboard from the drop down list.
Note: The dashboard utilised for the Daily stats is the one pictured: the Consult Overview dashboard.
Hubspot Reporting – Report 1 – Daily stats
3. Add Filters:
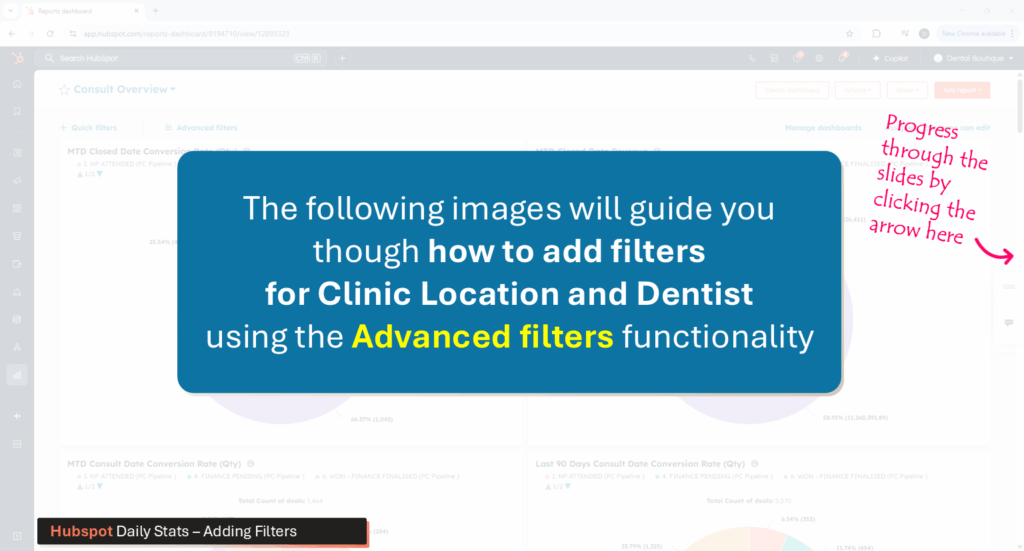
We can create specific dashboard views by adding filters. To compile the Daily Stats, we need to add filters for the Clinic Location and Dentist.
Navigate through the slider below to view how to add filters in Hubspot.
Follow the instructions in the images above
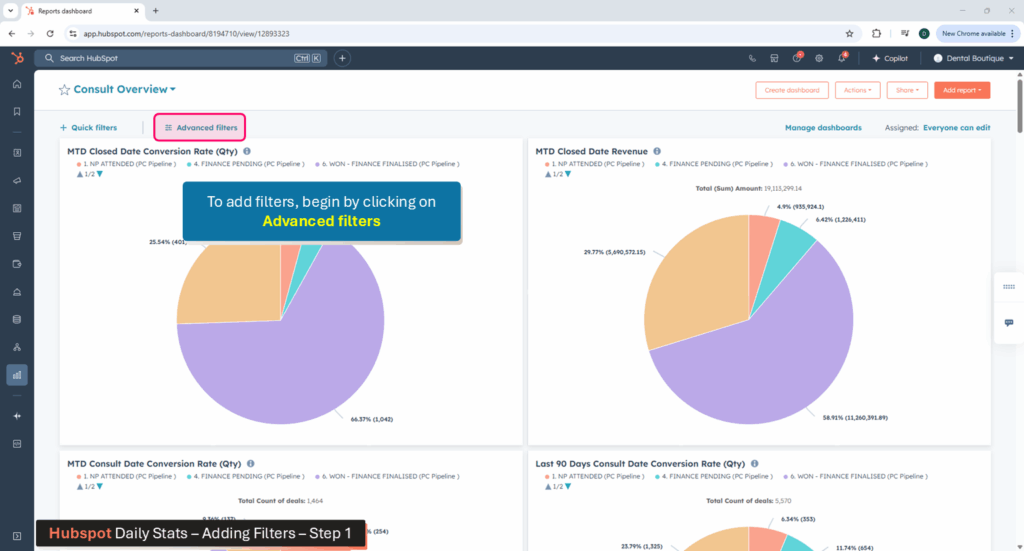
To add filters, begin by clicking on Advanced Filters in the top left corner of the screen (just below the Dashboard Title).
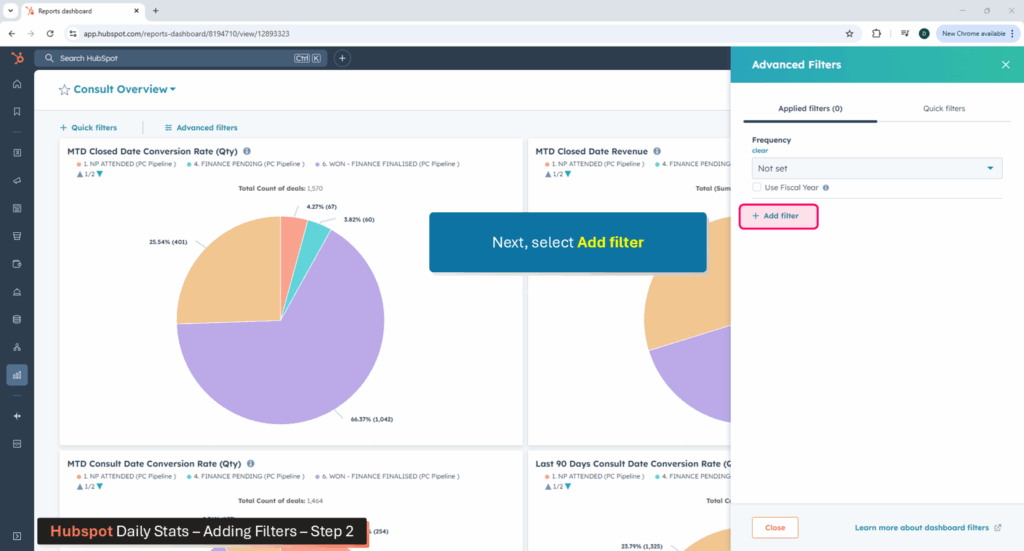
When the Advanced Filters menu opens on the right side of the screen, click on Add filter to begin adding the first filter (for Clinic Location).
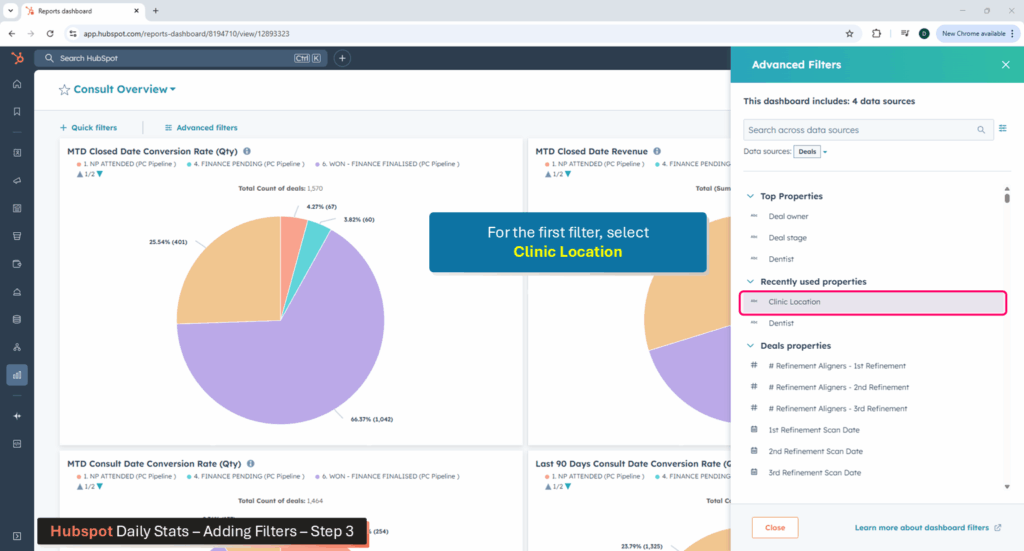
For the first filter, click on Clinic Location.
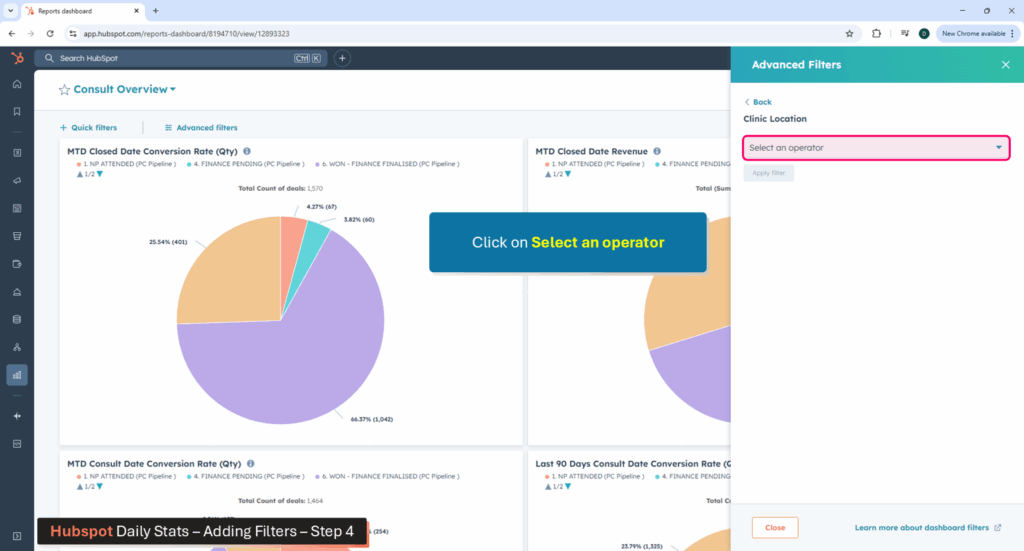
The next step is to Select an operator. Operators allow us to include or exclude specific data (for example, we want to include information related only to the clinic that we’re interested in reviewing).

The operator we need for the Daily Stats will include data for the clinic that we’re reviewing, so select the operator: is any of.

Now that we’ve chosen the “is any of” operator to include our clinic’s data, the next this to do is click on Search to search for the clinic location.
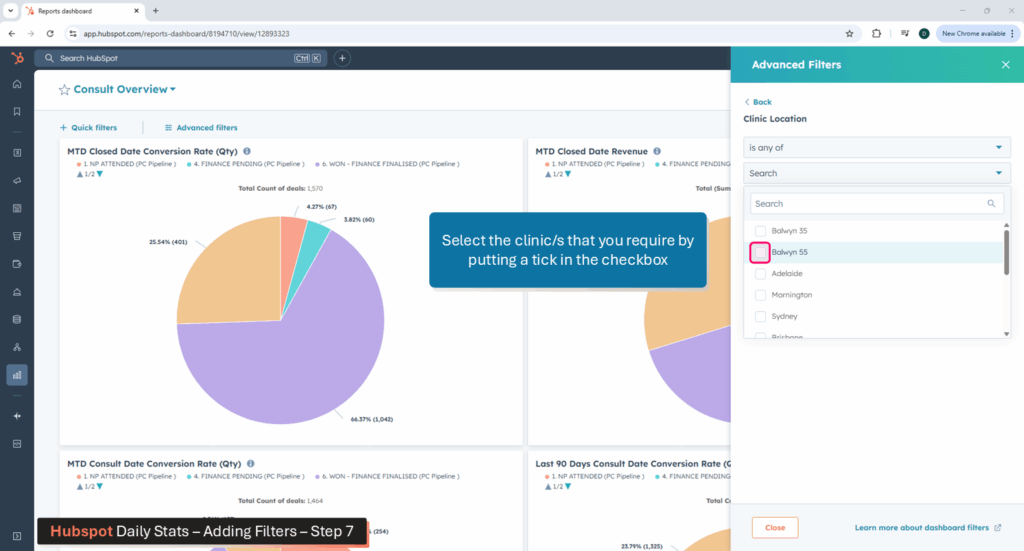
From the list of clinics, select the clinic that you need by ticking the box next to it.
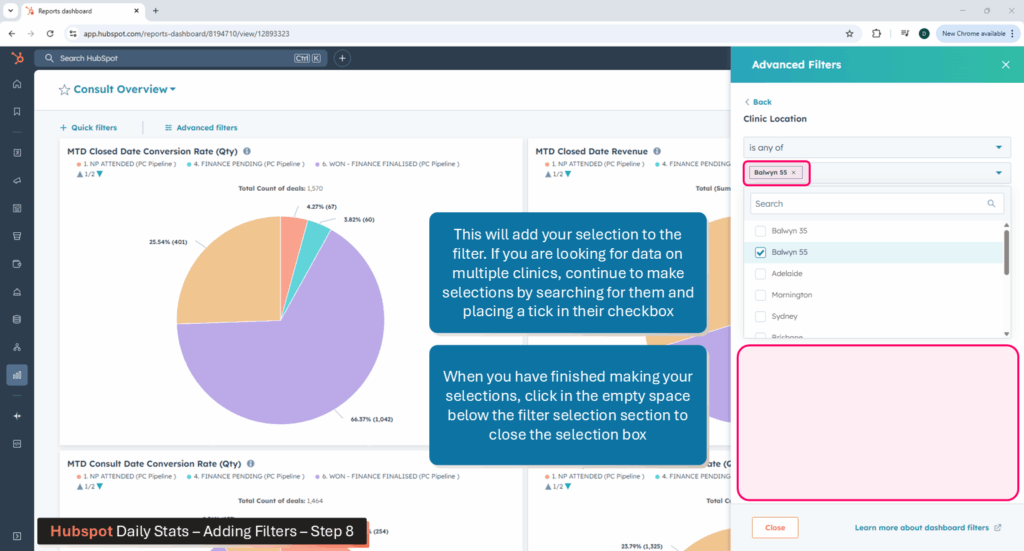
The selected clinic will now appear in the filter. Repeat this process to add multiple clinics.
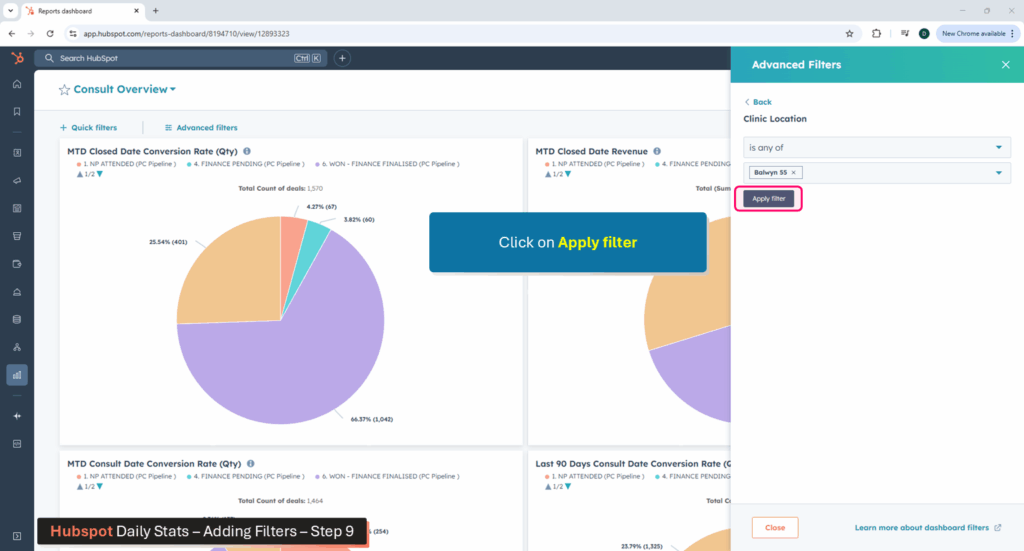
Once the clinic you require has been added to the filter, click on the Apply Filter button.
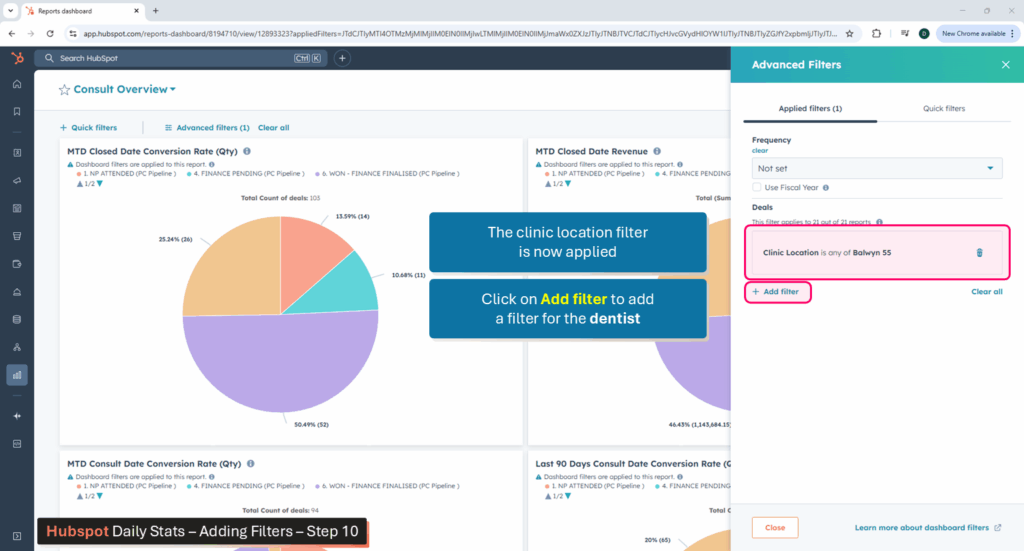
Click on Add filter to begin adding the second filter (for Dentist).
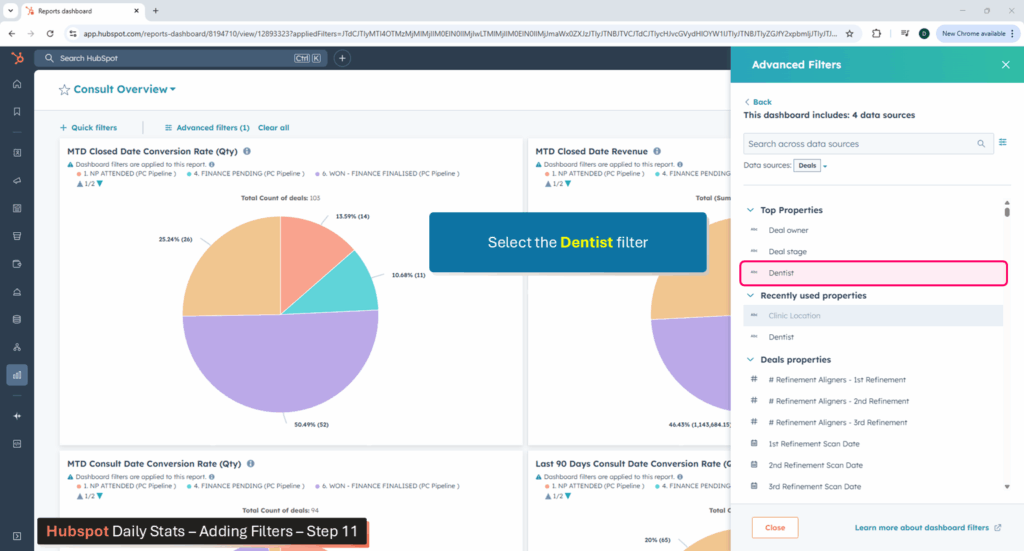
For the second filter, click on Dentist.

Click on Select an operator.
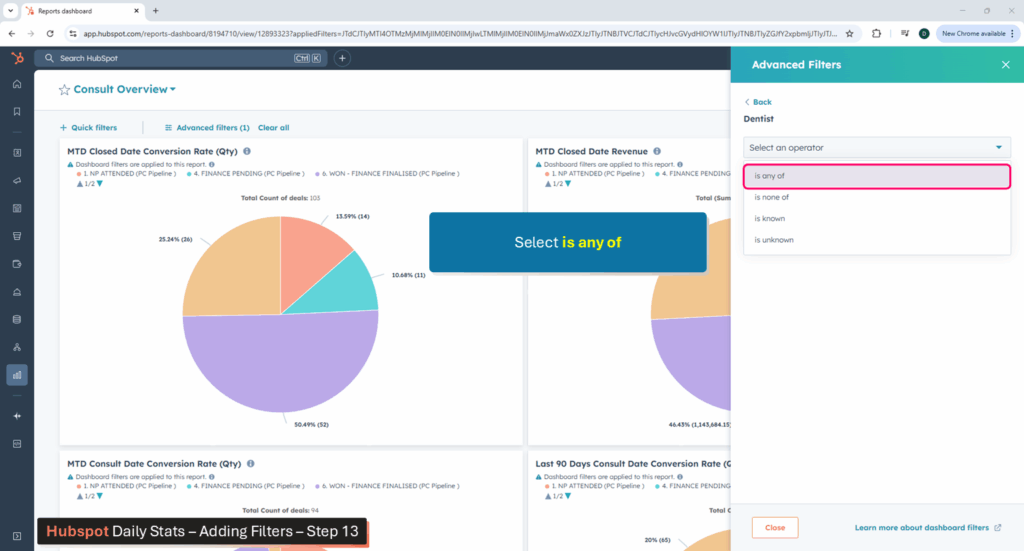
From the operator drop-down list, select is any of

Click on Search to search for the dentist/s.
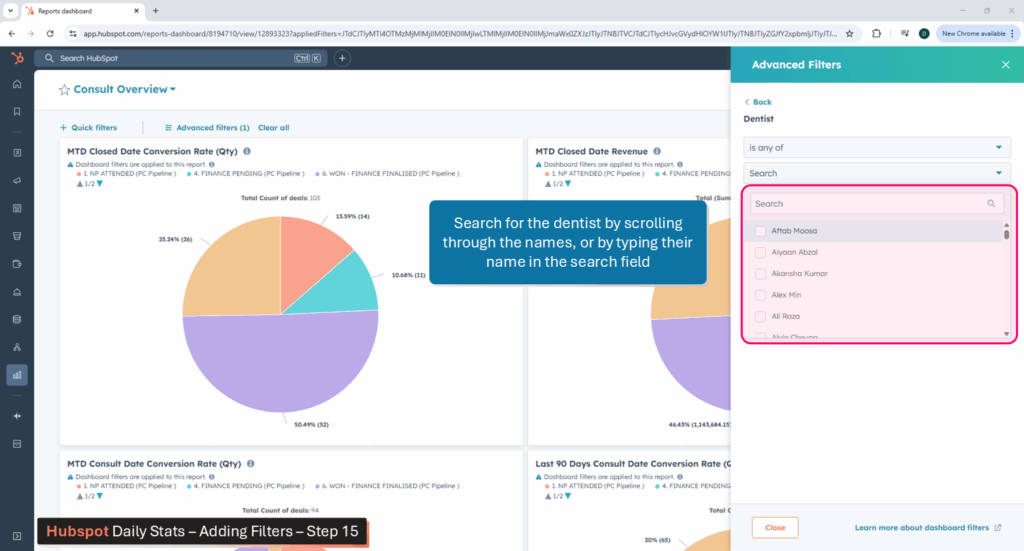
Either type the Dentist name, or scroll through the list to locate the one you need.
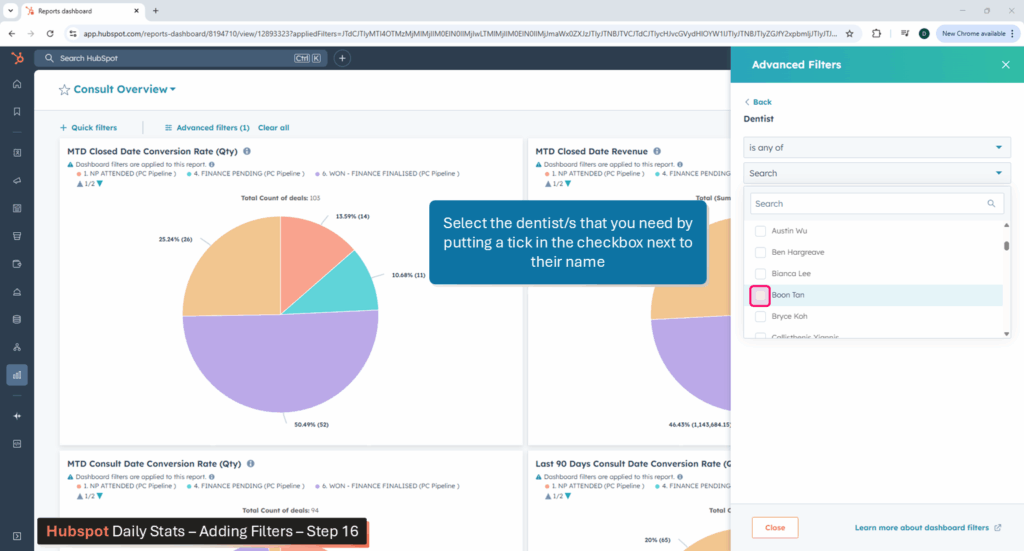
Once you have located the dentist, select them by placing a tick on the box nest to their name.
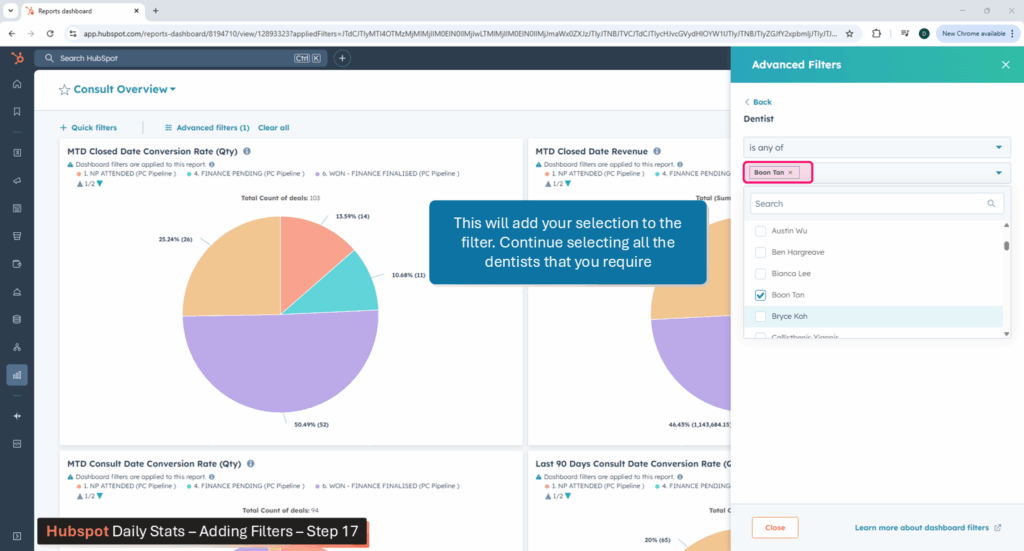
Continue to select more dentists (if applicable).
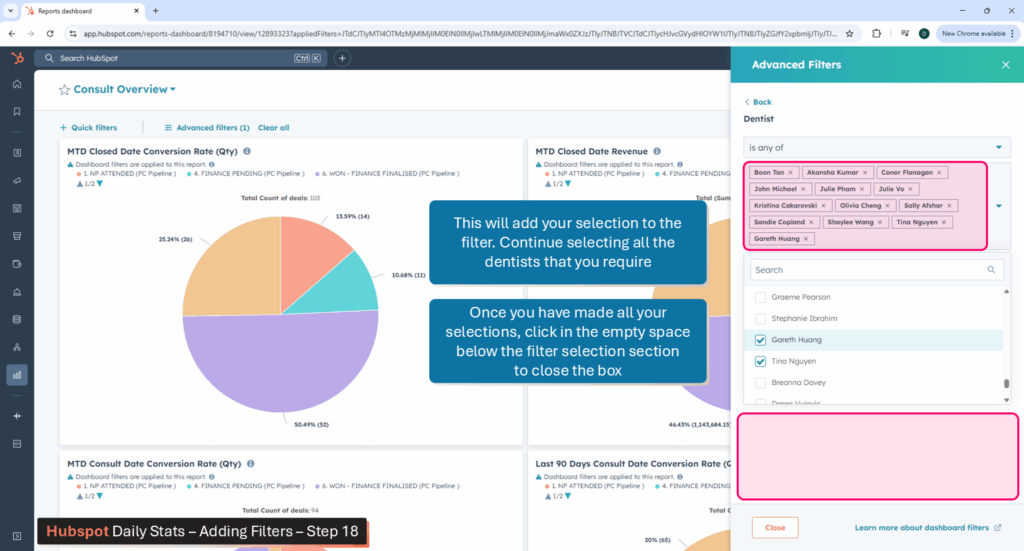
Once you have made all your selections, click in the empty space below the search to close the search box.
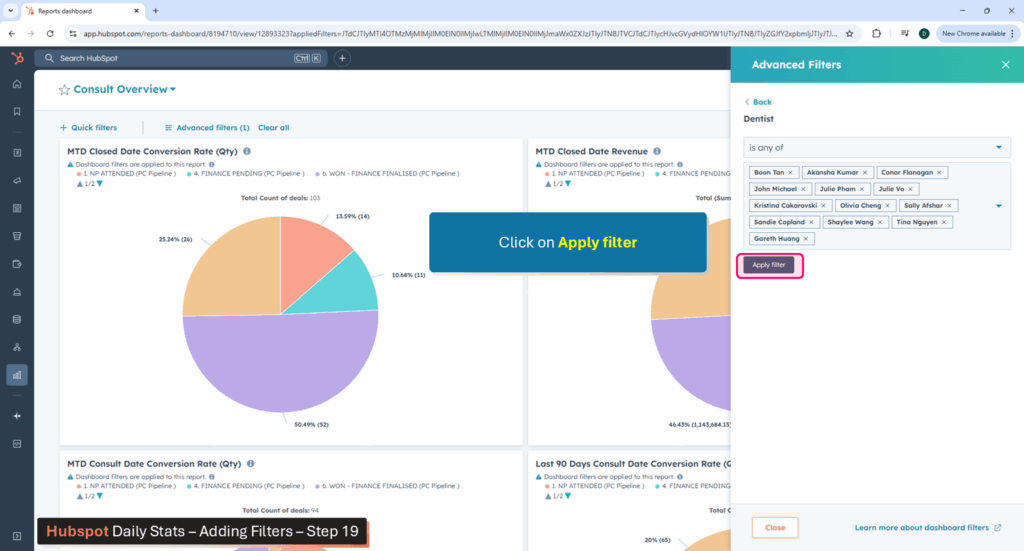
Click on Apply Filter to add the filtered Dentists to the dashboard.
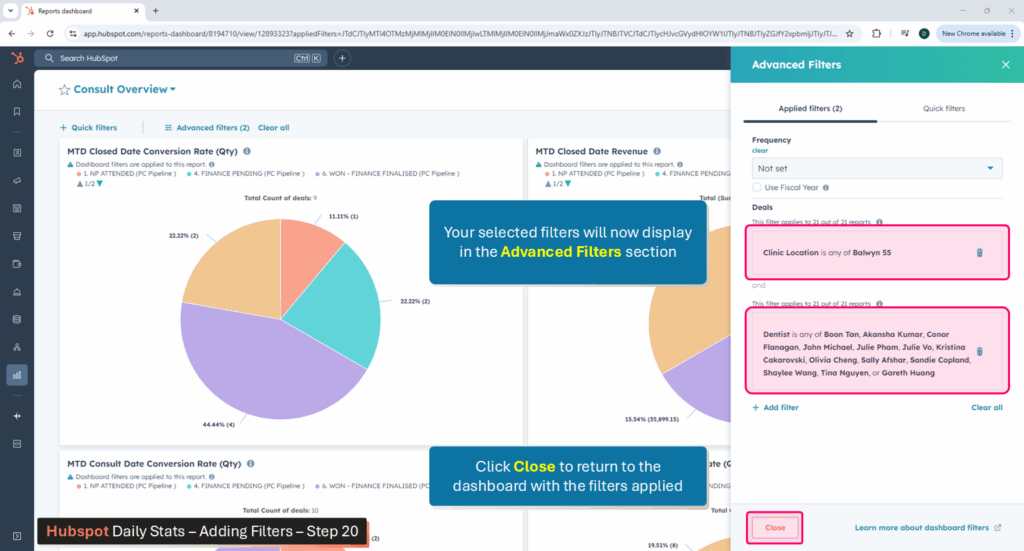
The clinic location and dentist filters have now been applied. Click on Close to close the Advanced Filters menu.
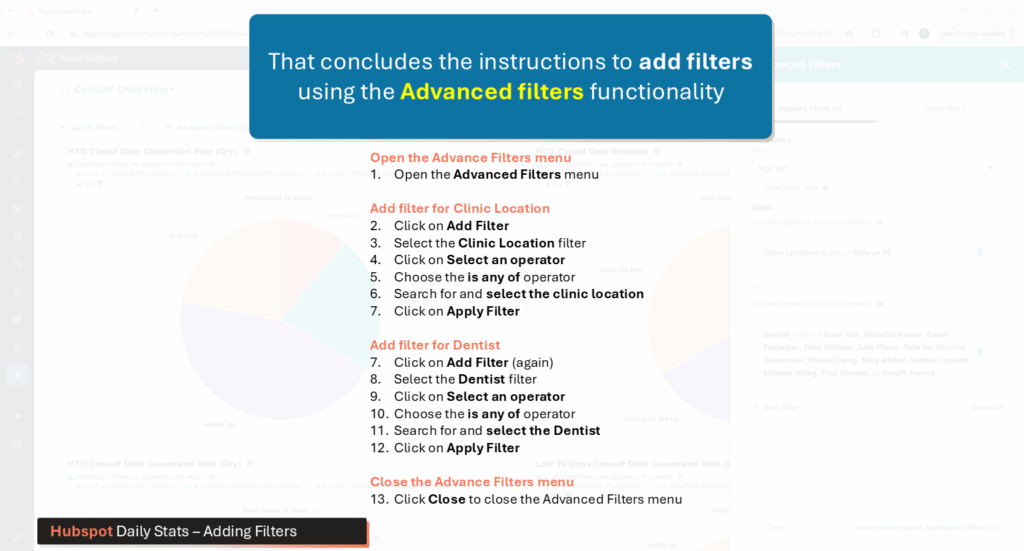
Here is a summary of the steps to add a filter.
Hubspot Reporting – Report 1 – Daily stats
4. Viewing the Dashboard:
Once you have added your filters and returned to the dashboard, you will notice that the data has automatically updated based on the filters that you selected.
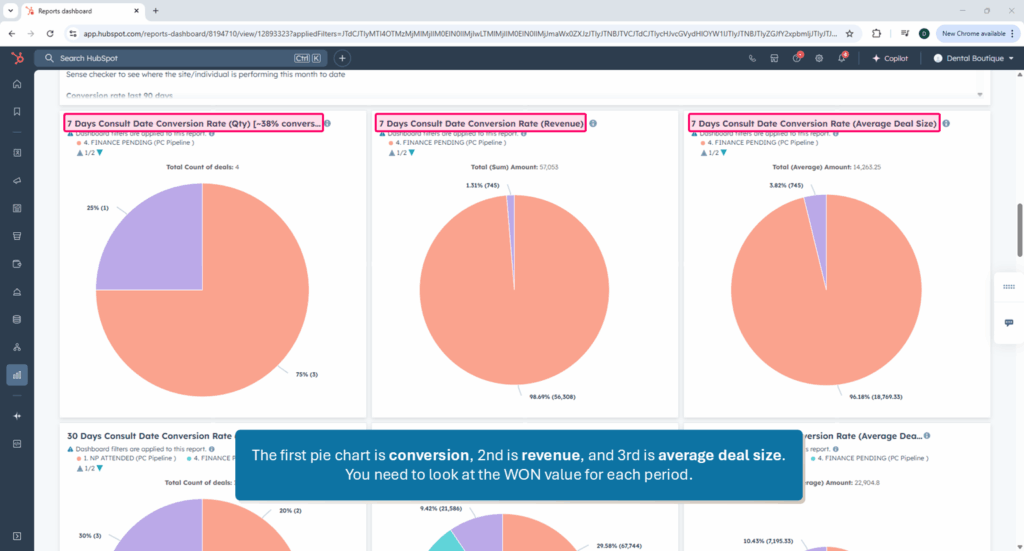
Scroll down until you see the pie charts for 7 Days data.
The first pie chart is conversion, 2nd is revenue, and 3rd is average deal size. You need to look at the WON value for each period.
Continue scrolling down for 30 Day and 30-60 Day metrics.
Hubspot Reporting – Report 1 – Daily stats
5. Viewing the Dashboard: Understanding the data
In the title of the pie chart, there will be a guide; for 7 days, the guide is 38% +
In the example below, this clinician has seen 3 deals over the past 7 days, and 1 deal has gone into won, meaning his conversion is sitting at 33.33%.
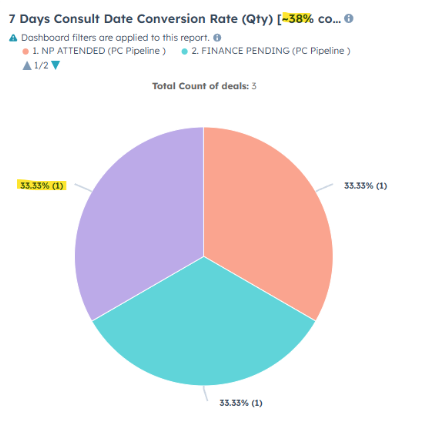
Hover over the colour to make sure you are looking at Won – Won is usually purple however sometimes the colours will change.
NOTE: if the clinician you are looking at sees a lot of AOI patients or sees a lot of super release patients, you would expect their won percentage to be smaller than the suggested range, however they should have a large portion in finance pending. Red flags are when there is a large amount of deals in NP attended or Lost.
Click here to return to the top of this page
Hubspot Reporting – Report 2 – Hubspot vs Core
You will need both Hubspot and Core for this report. This report is really important to make sure that no NPS that have been seen in the clinic have been missed in Hubspot. If a patient was accidentally missed in Hubspot, you would have a higher number of NP attended in Core than deals lodged in Hubspot.
If you were checking Hubspot Vs Core for yesterday – you would follow the below:
Hubspot Reporting – Report 2 – Hubspot vs Core
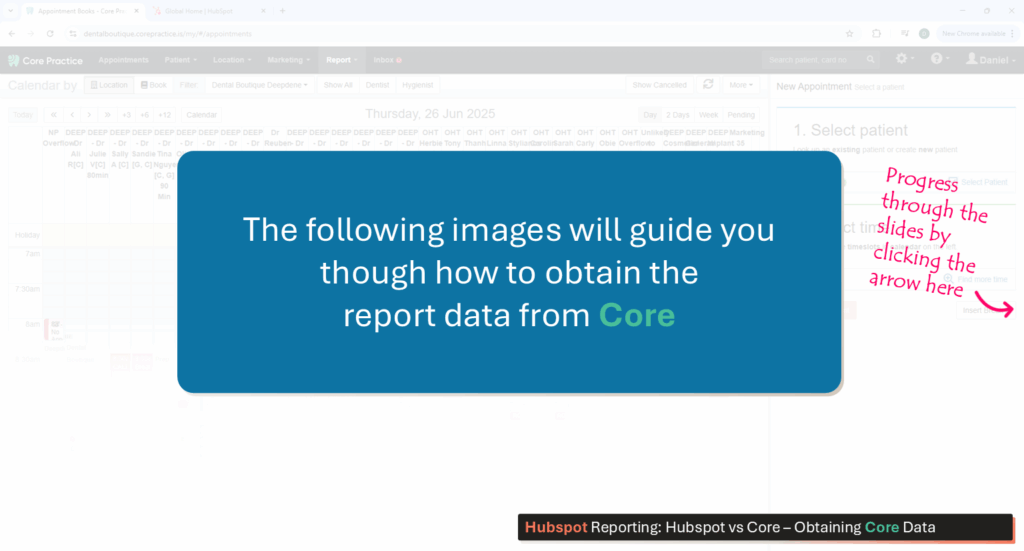
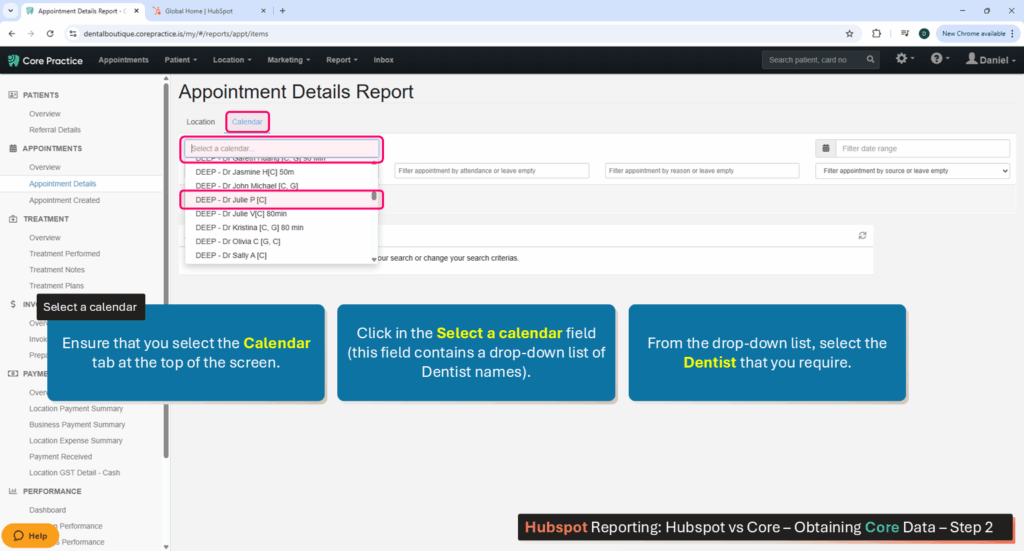
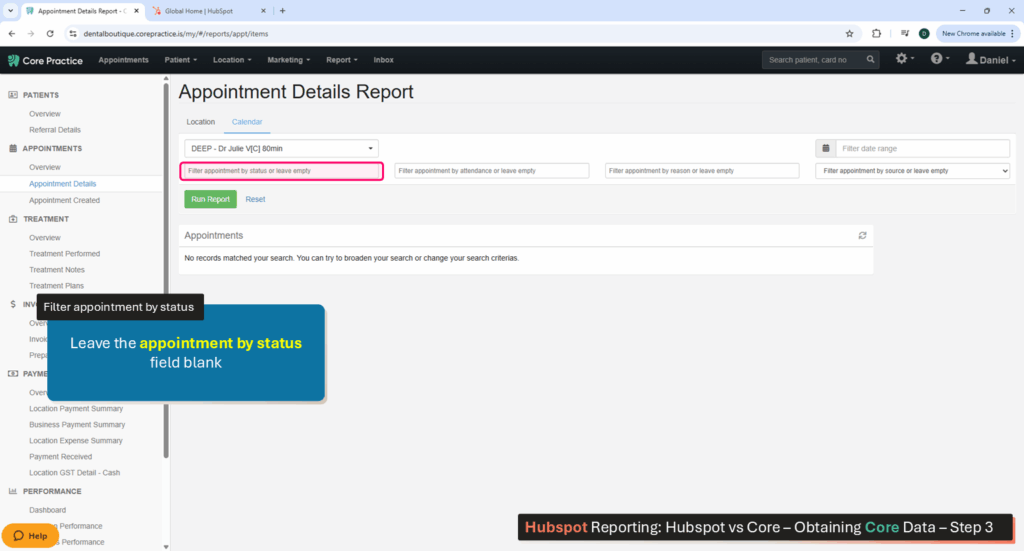
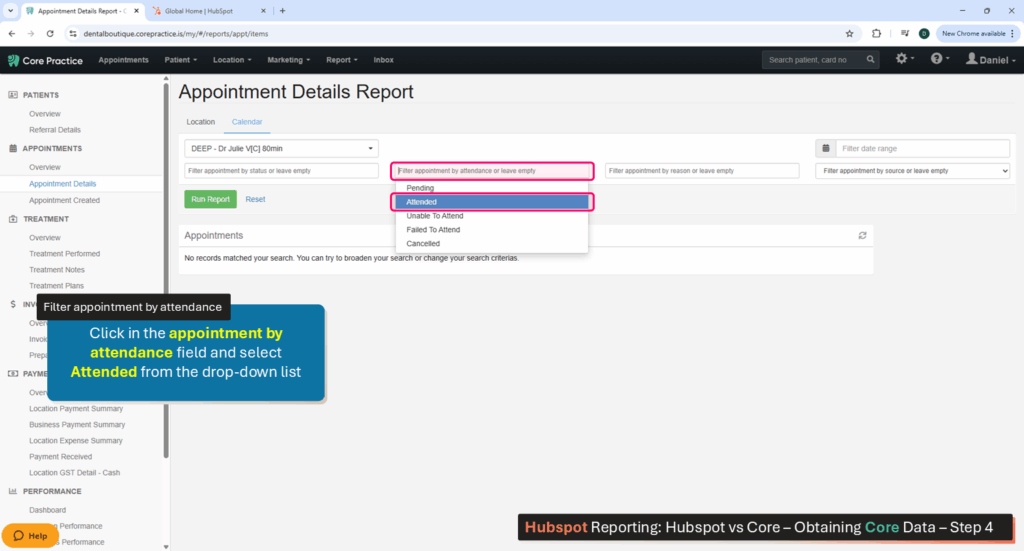
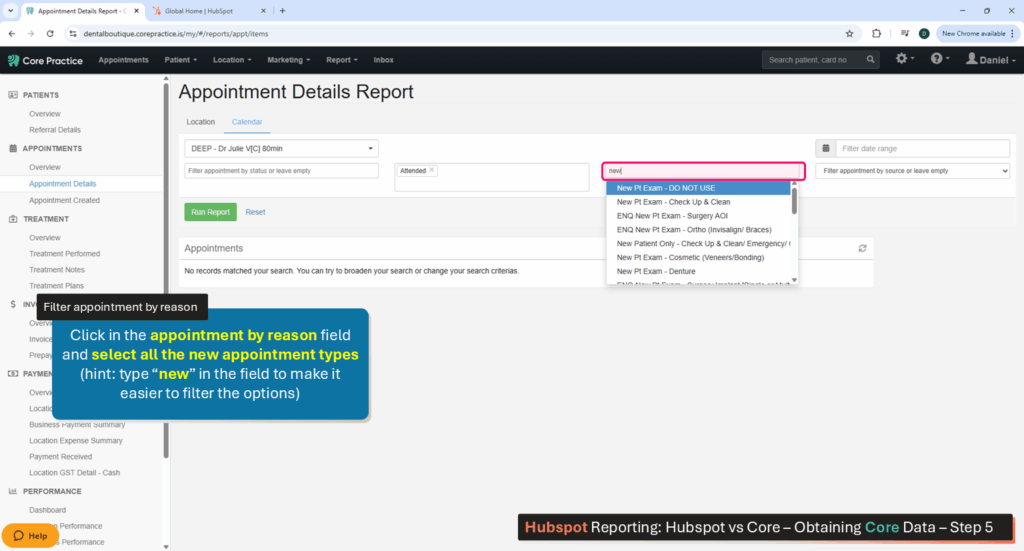
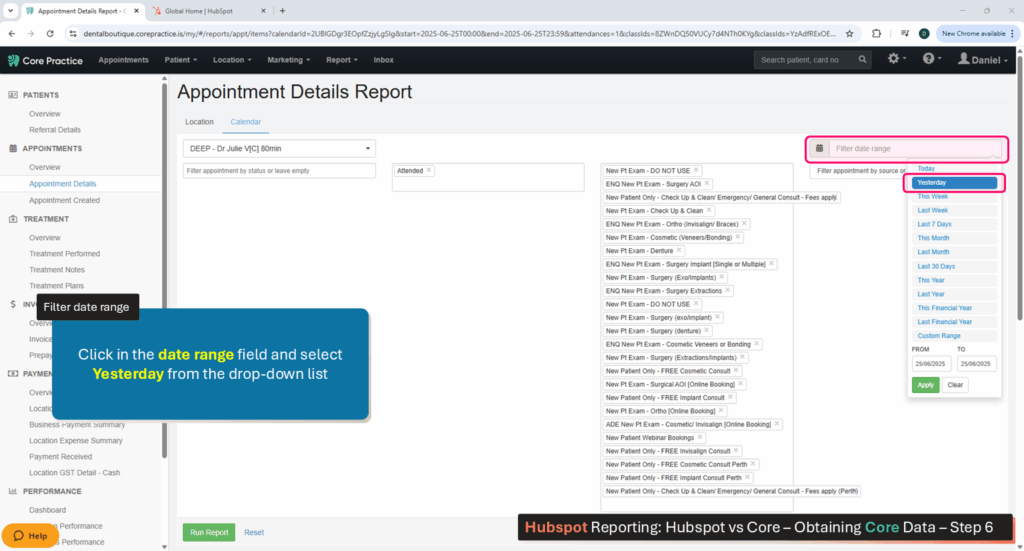
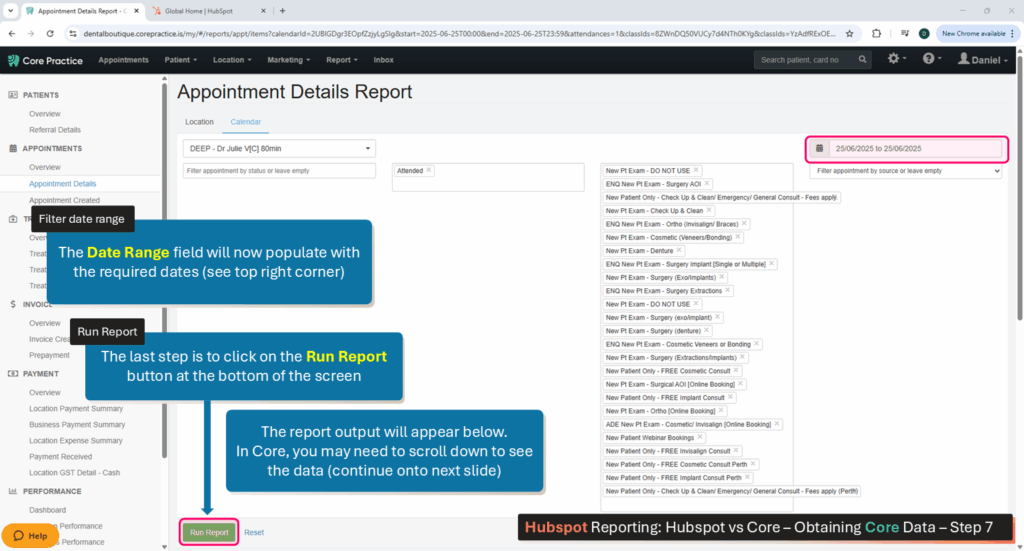
1. Obtain the data from Core:
The first part of this process is to obtain the data from Core.
Navigate through the slider below to view how to navigate Core to obtain the data you need.
Follow the instructions in the images above
To add filters, begin by clicking on Advanced Filters in the top left corner of the screen (just below the Dashboard Title).
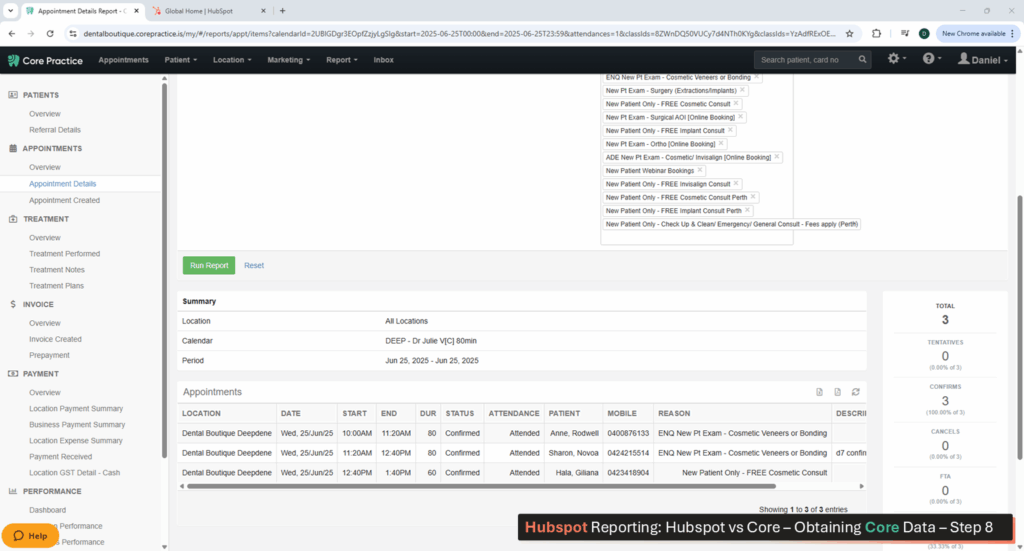
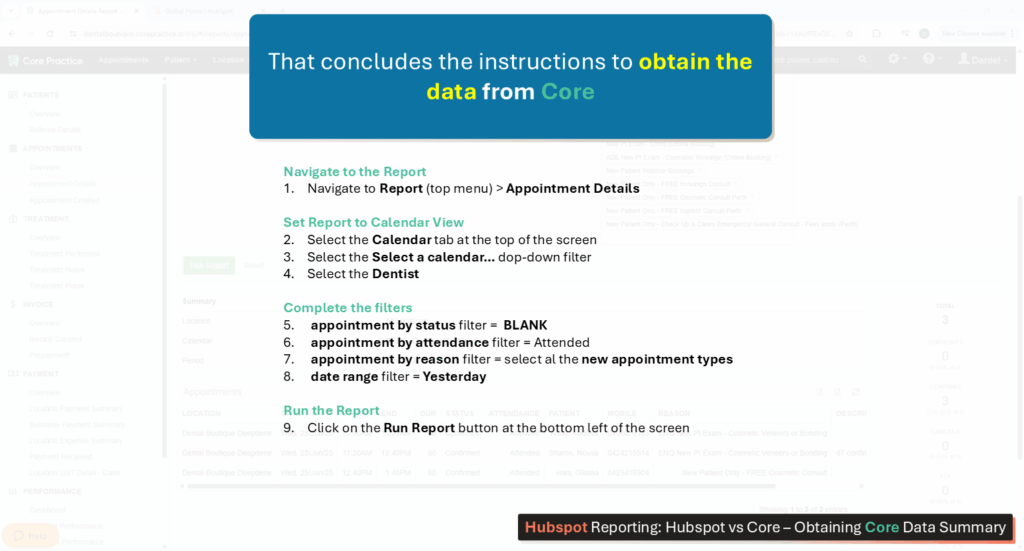
Here is a summary of the steps.
Note down the number and check it against Hubspot for the same date. To do this, follow the below steps:
Hubspot Reporting – Report 2 – Hubspot vs Core
2. Obtain the data from Hubspot:
Navigation:
Open Hubspot
1. Select CRM (left menu)
2. Select Deals (sub menu)
Select Dashboard and Add Filters:
Select the correct dashboard:
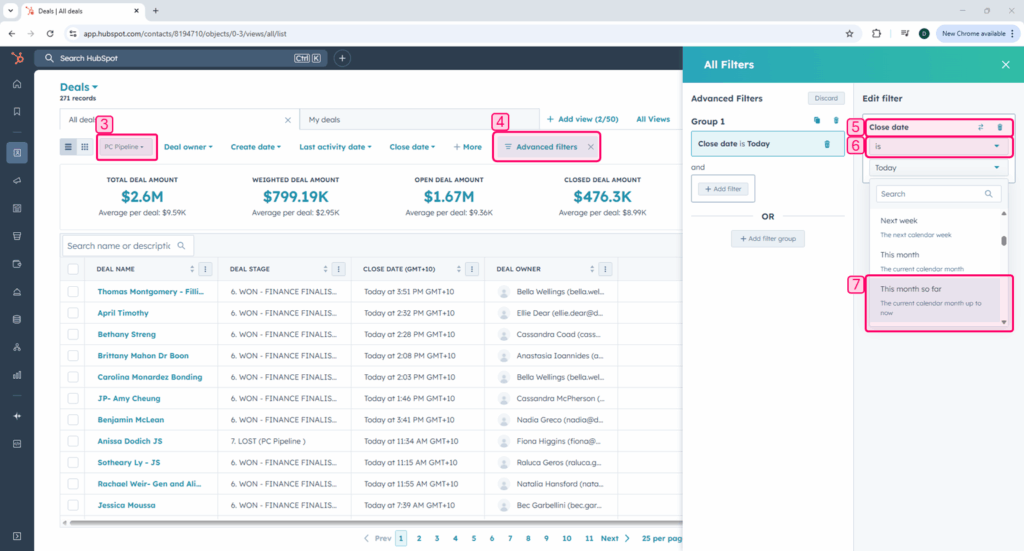
3. Ensure that the PC Pipeline dashboard is selected
Filter 1 (Consult Date):
4. Select Advanced Filters (top menu)
5. Search for Consult Date and select it
6. Leave the top drop-down field with the word is
7. Click on the bottom drop-down field and select Yesterday
Filter 2 (Dentist):
4. Select Add Filter (whilst still in the Advanced Filters section)
5. Search for Dentist and select it
6. Leave the top drop-down field with the word is any of
7. Expand the bottom drop-down field and select the Dentist that you require data for
Hubspot Reporting – Report 2 – Hubspot vs Core
3. Compare the numbers:
This will now give you how many consults Dr Sarah saw in Core yesterday and how many deals she saw in Hubspot yesterday. Hubspot will sometimes be higher due to Free/2nd Consults or seen or if someone closed on another deal during a non NP appointment type. Hubspot should never be lower.
Click here to return to the top of this page
Hubspot Reporting – Report 3 – Deal Tags
These deal tags potentially highlight issues within the PC space.
Platform: Hubspot
Navigation:
Open Hubspot
1. Select CRM (left menu)
2. Select Deals (sub menu)
Select Dashboard and Add Filters:
Select the correct dashboard:
3. Ensure that the PC Pipeline dashboard is selected
Filter 1 (Deal Owner):
4. Select Advanced Filters (top menu)
5. Search for Deal Owner and select it
6. Leave the top drop-down field with the word is any of
7. Expand the bottom drop-down field and select the PC that you require data for
Filter 2 (Deal Tags):
4. Select Add Filter (whilst still in the Advanced Filters section)
5. Search for Deal Tags and select it
6. Leave the top drop-down field with the word is any of
7. Expand the bottom drop-down field and select the following tags:
- No Dentist – this tag will show you any deals that do not have a dentist associated with the deal.
- No Activity / Task – this tag will show you any deal that does not have a future task – it will also show you deals that are due today, these ones can be ignored.
This PCs last task was 19 days ago with no activity scheduled. A future task has been missed for this patient – you will need to follow up with the PC asap.
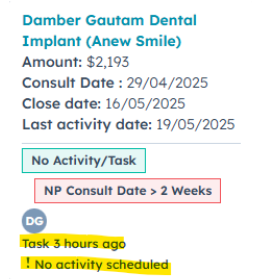
This PCs last task was 3 hours ago with no further activity scheduled. When you click on the deal, you will see that the task was not completed 3 hours ago and is still outstanding, however this is not a true missed task
- NP consult date > 2 weeks – this will show you any deals that have been in NP attended for more than 2 weeks since their consult date. Ideally no deals should be left in NP attended for that long. However there are some instances where this might be required. Review the deal, review the task history / communications and discuss next steps with your PC.
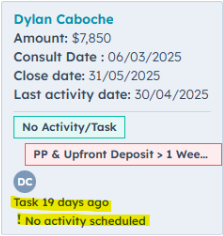
- PP & Upfront Deposit > 1 Week ago from NP Consult Date – this tag will show you any deal that does not have a future task – it will also show you deals that are due today, these ones can be ignored.
- Super > 6 Week from NP Consult Date – this will show you any deals that are in finance pending due to Super release, yet it has been over 6 weeks since consult date. Sometimes patients may not go with super straight away, and may decide to do this after several weeks. Discuss these deals with your PCs to determine if there are any concerns about a potential misspent funds or if the process is just longer than expected.
- No Task – Follow Up Later Date – this will show you any deals that are in Lost, follow up at a later date, but have no task associated. All deals in Lost – follow up at a later date must have a task.
- 6 Months in Follow Up Later Date – this will show you any deals that have been in Lost – follow up at a later date for more than 6 months, these deals will likely need to be moved to lost
Click here to return to the top of this page
Hubspot Reporting – Report 4 – WoW Dentist Stats
The WoW Dentist Stats on the KPI spreadsheet must be done by COB Tuesday every week. The tab looks at both the clinic as a whole as well as the individual clinicians.
What: The last 90 days Conversion
Platform: Hubspot
Navigation:
Open Hubspot
Select Reporting (left menu)
Select Dashboards (sub menu)
Dashboard:
Dentist & PC WoW Stats
Advanced Filters:
Filter 1 (Deal Owner):
Select Advanced Filters (top menu)
Search for Clinic Location and select it
Leave the top drop-down field with the word is any of
Second drop-down menu: [select your clinic from the list]
The first graph that appears will be consult date of the past 90 Days and the second graph is close date of the past 90 days.
What’s the difference?
Consult date = what is the conversion rate of deals that have closed over the past 90 days?
Close date = Even if we saw a patient in January 2025, and now we are in May 2025 and they closed last week, this person will be showing up in the past 90 day stats, as their closed date was in the past 90 days – not their consult date.
For this report, you are looking at the last 90 days consult date, you will look at each of your dentists, and record their won % for the past 90 days. You will need to hover your mouse over the graph to see the percentage breakdown of each deal stage.
What: Tier Structure
Platform: KPI Spreadsheet
How To: Select the correlating tier structure to the 90 day conversion statistic
60 – 69% = Tier 1
50 – 60% = Tier 2
< 50% = Tier 3
What: Total Weekly NP Attended Target
Platform: KPI Spreadsheet
How To: Input the number of NP the clinic and individual dentists should see weekly
What: Total Weekly NP Attended Target
Platform: Core
Navigation:
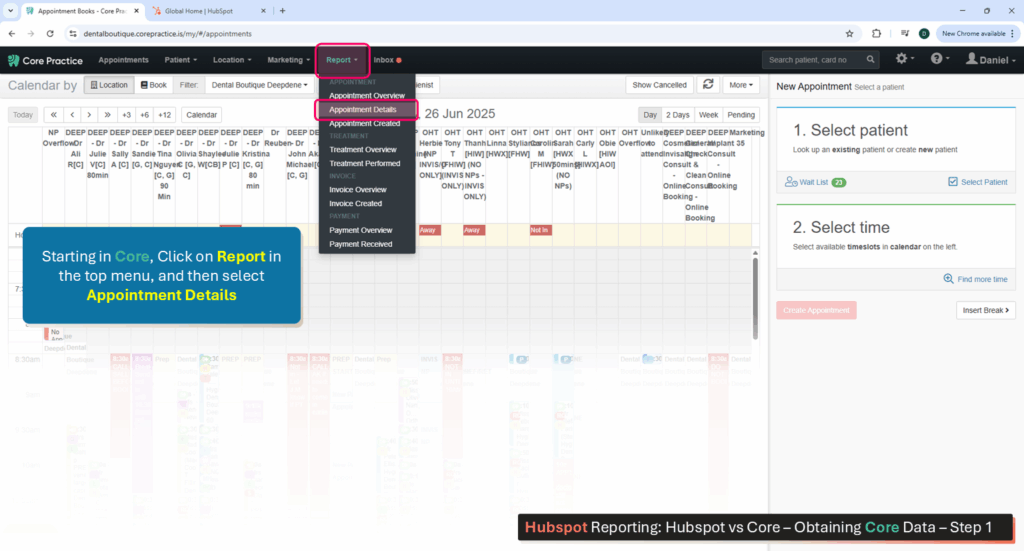
Access the report via Core Practice > Reports (top menu) > Appointment Details
Select Filters: (note: select location if reviewing the clinic or calendar if reviewing individual dentists)
Filter by Attendance: Attended
Filter by appointment reason: Select ALL new patient appointment types
Filter by Date: Last Week
Record for clinic and for individual dentists.
What: Total FTA % for last week
Platform: Core
Navigation:
Access the report via Core Practice > Reports (top menu) > Appointment Details
Select Filters: (note: select location if reviewing the clinic or calendar if reviewing individual dentists)
Filter by Attendance: Attended & Unable to Attend & Failed to Attend
Filter by appointment reason: Select ALL new patient appointment types
Filter by Date: Last Week
Make a note of the number.
If, for example, the number was 20 in total, then you will need to pull the same report, however change the appointment Attended to Unable to Attend & Failed to Attend.
If, for example, that number was 3, your weekly FTA rate would be 3/20 x 100 = 15%
What: Total FTA % for MTD
Platform: Core
Navigation:
Access the report via Core Practice > Reports (top menu) > Appointment Details
Select Filters: (note: select location if reviewing the clinic or calendar if reviewing individual dentists)
Filter by Attendance: Attended & Unable to Attend & Failed to Attend
Filter by appointment reason: Select ALL new patient appointment types
Filter by Date: 1st of the month to the end of last week
Make a note of the number.
If, for example, the number was 45, then you will need to pull the same report, however change the appointment Attended to Unable to Attend & Failed to Attend.
If, for example, that number was 10, your weekly FTA rate would be 10/40 x 100 = 25%
What: Weekly Prepayments Received
Process For Clinic
Platform: Core
Navigation:
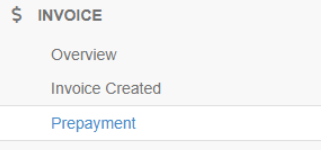
Access the report via Core Practice > Reports (top menu) > Payment Received
Then select Prepayment from the Invoice menu on the left side
Select Filters:
Location: [select you clinic]
Providers: ALL PROVIDERS
All or Unallocated: ALL
Date: Select last week’s date range
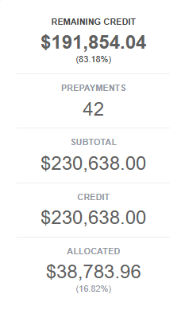
The figure you are looking for is ‘credit’
Process For Clinicians
Platform: Hubspot
Navigation:
Open Hubspot
Select CRM(left menu)
Select Deals (sub menu)
Dashboard:
PC Pipeline
Advanced Filters:
Add Filter: Close Date
Operator (first drop-down menu): is between
Second drop-down menu: [enter last week’s dates]
Add Filter: Dentist
Operator (first drop-down menu): is any of
Second drop-down menu: Dentist Name
Add Filter: Deal Stage
Operator (first drop-down menu): is any of
Second drop-down menu: WON Finance Finalised
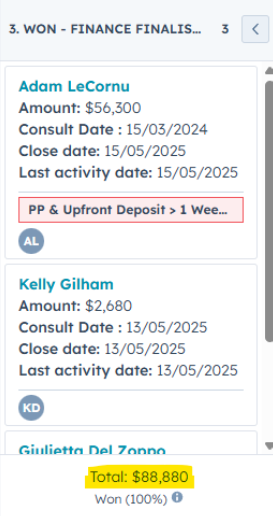
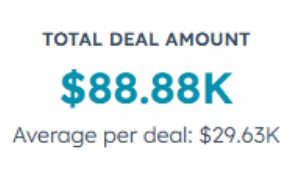
The following section is MTD prepayments received, you will repeat the above, but change the dates from the 1st of the month until the end of last week.
What: Weekly Billings Received
Platform: Core
Navigation:
Access the report via Core Practice > Reports (top menu) > Payment Received
Select Filters:
Location: [select your location]
Providers: ALL PROVIDERS
Pyaments: All Payments
Date: Last week
Payment Methods: BLANK
Invoice Types: Credit, Invoice
To find the clinician, it is the same as above, however under the provider you would select the clinician name instead of all providers.
TIP: If you have a referral system (Akansha Kumar2) then you would need to run the report for Akansha Kumar and then again for Akansha Kumar2, you would need to add these numbers together for the combined total.
The following section is MTD billings received, you will repeat the above, but change the dates from the 1st of the month until the end of last week.
What: Strategy To Close The Gap (Tier Dentist + Other Strategy for Clinic and Individuals)
Platform: N/A
How to: This will be case by case – there are several possibilities.
- Reducing NP numbers
- Encouraging a lead dentist to mentor low performer
- Increasing someone from tier 2 to tier 1 and increasing high quality NPs
- Sit in on Dentist to PC handovers to check tiering
- Sit in on consults to ensure correct consultation process is followed
- etc.
Click here to return to the top of this page
Hubspot Reporting – Report 5 – WoW PC Stats
The WoW Dentist Stats on the KPI spreadsheet must be done by COB Tuesday every week. The tab looks at individual PCs.
What: The last 90 days Conversion
Platform: Hubspot
Navigation:
Open Hubspot
Select Reporting (left menu)
Select Dashboards (sub menu)
Dashboard:
Dentist & PC WoW Stats
Advanced Filters:
Filter 1 (Clinic Location):
Select Advanced Filters (top menu)
Search for Clinic Location and select it
Leave the top drop-down field with the word is any of
Second drop-down menu: [select your clinic from the list]
Scroll down until you see ‘Conversion rate of PC – consult date last 90 days’
For this report, you are looking at the last 90 days consult date, you will look at each of your PCs, and record their won % for the past 90 days. You will need to hover your mouse over the graph to see the percentage breakdown of each deal stage.
What: Total Weekly NPs Seen
Platform: Hubspot
Navigation:
Open Hubspot
Select Reporting (left menu)
Select Dashboards (sub menu)
Dashboard:
Dentist & PC WoW Stats
Advanced Filters:
Filter 1 (Consult Date):
Select Advanced Filters (top menu)
Search for Consult Date and select it
Leave the top drop-down field with the word is between
Second drop-down menu: Last Week
Filter 2 (Deal Owner):
Search for Deal Owner and select it
Leave the top drop-down field with the word is any of
Second drop-down menu: PC Name
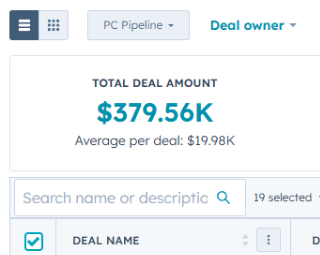
If you select the list view by clicking on the three lines, and click on the first small square, a count will come up – 19 selected.
What: Weekly Collections Received
Platform: Hubspot
Navigation:
Open Hubspot
Select CRM(left menu)
Select Deals (sub menu)
Dashboard:
Dentist & PC WoW Stats
Advanced Filters:
Filter 1 (Close Date):
Select Advanced Filters (top menu)
Search for Close Date and select it
Leave the top drop-down field with the word is between
Second drop-down menu: Last Week
Filter 2 (Deal Stage):
Search for Deal Stage and select it
Leave the top drop-down field with the word is any of
Second drop-down menu: WON Finance Finalised
Filter 3 (Deal Owner):
Search for Deal Owner and select it
Leave the top drop-down field with the word is any of
Second drop-down menu: PC Name
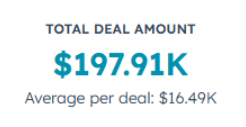
Monthly collections received is the same as the above, however the date range needs to change from the 1st of the month until the end of last week.
What: Strategy To Close The Gap
Platform: N/A
How to: This will be case by case – there are several possibilities.
- PM or PC lead to sit on handovers and PC consult to ensure correct process is being followed
- Review NP tracking of PCs dentists – are they on top of their work?
- Has the PC been working with their dentist to encourage Loom videos?
- What are the tasks like – are they at the correct time frames?
- Has the PC been following workflow?
- Is further training required? Should the PC sit in on a high performing PC?